|
Here are a tiny selection of screenshots from the Time Mapper UHD 4K World Clock. Click any image to show that full sized image in a new browser-tab.
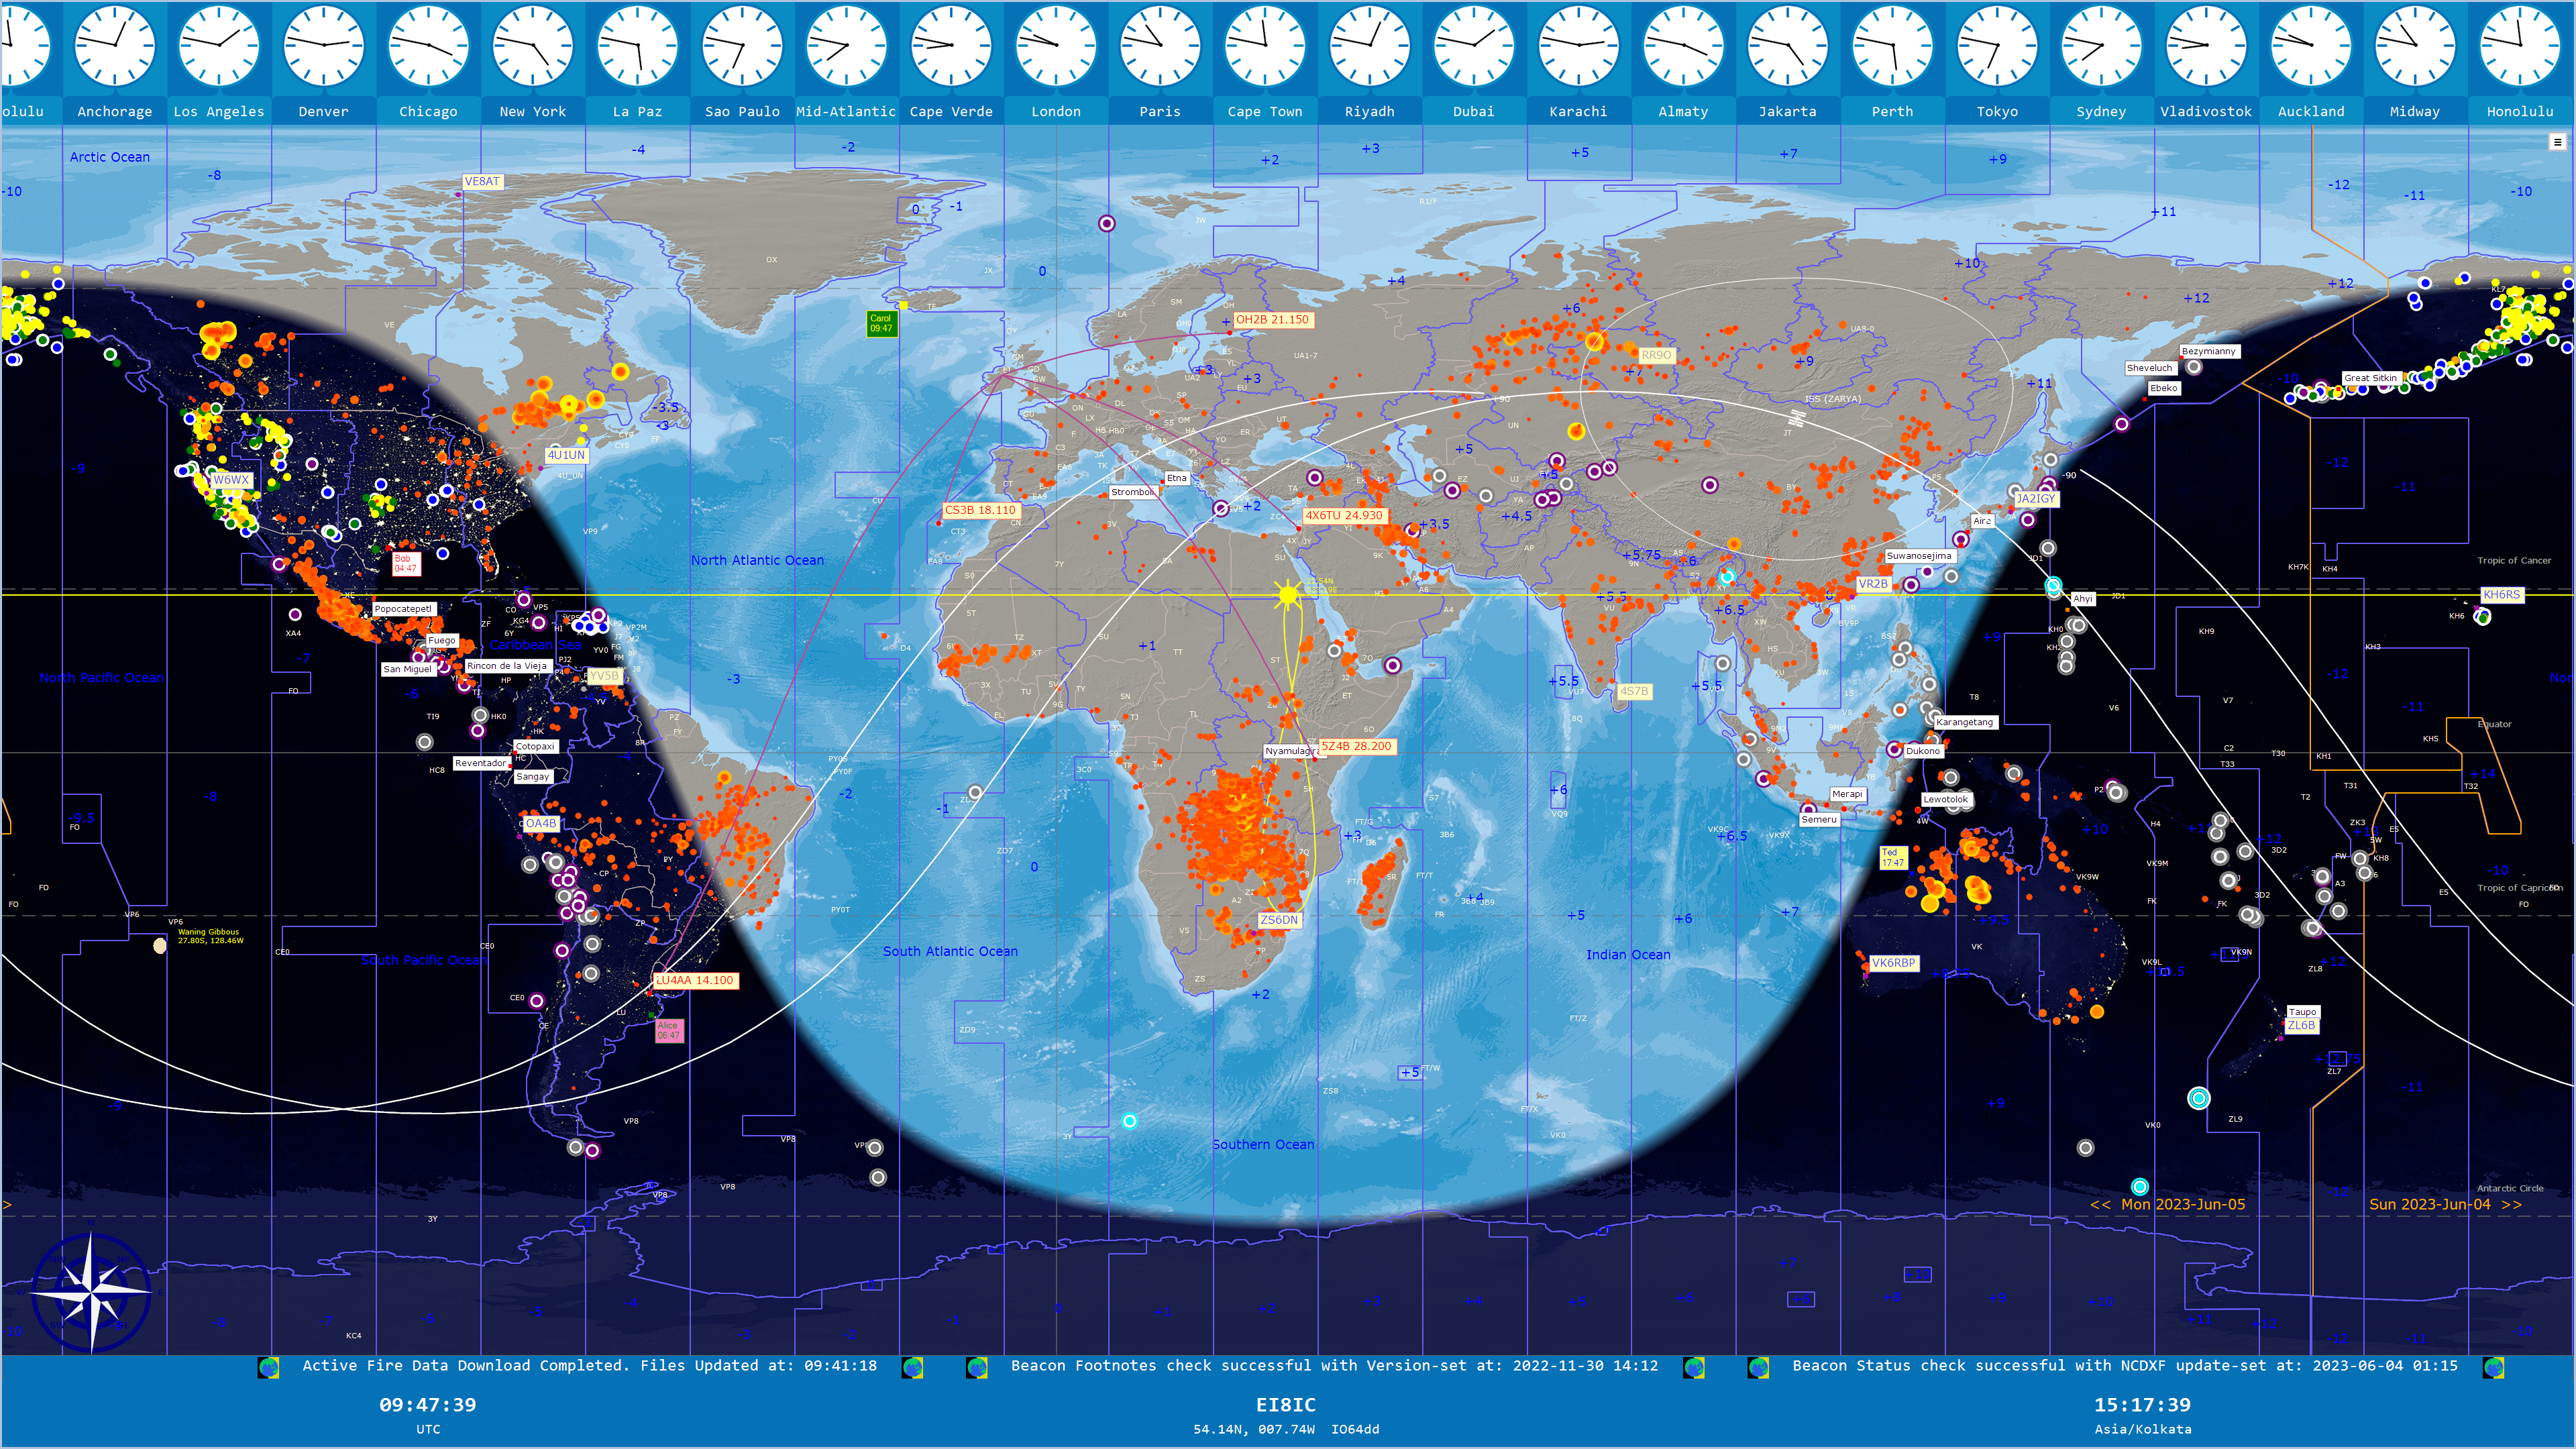
Even quite a simple map can show a lot of information. Four markers are showing: Bob, Carol, Ted, and Alice. Also the NCDXF beacons, Amateur Radio Prefixes, and the track of the Space Station. We are also monitoring Active Fire Data, Earthquakes, and Volcanos. The 'News Ticker' along the bottom shows as datasets are updated.
Compare this in HD and 4K Resolution:
4K Map - HD Map
|
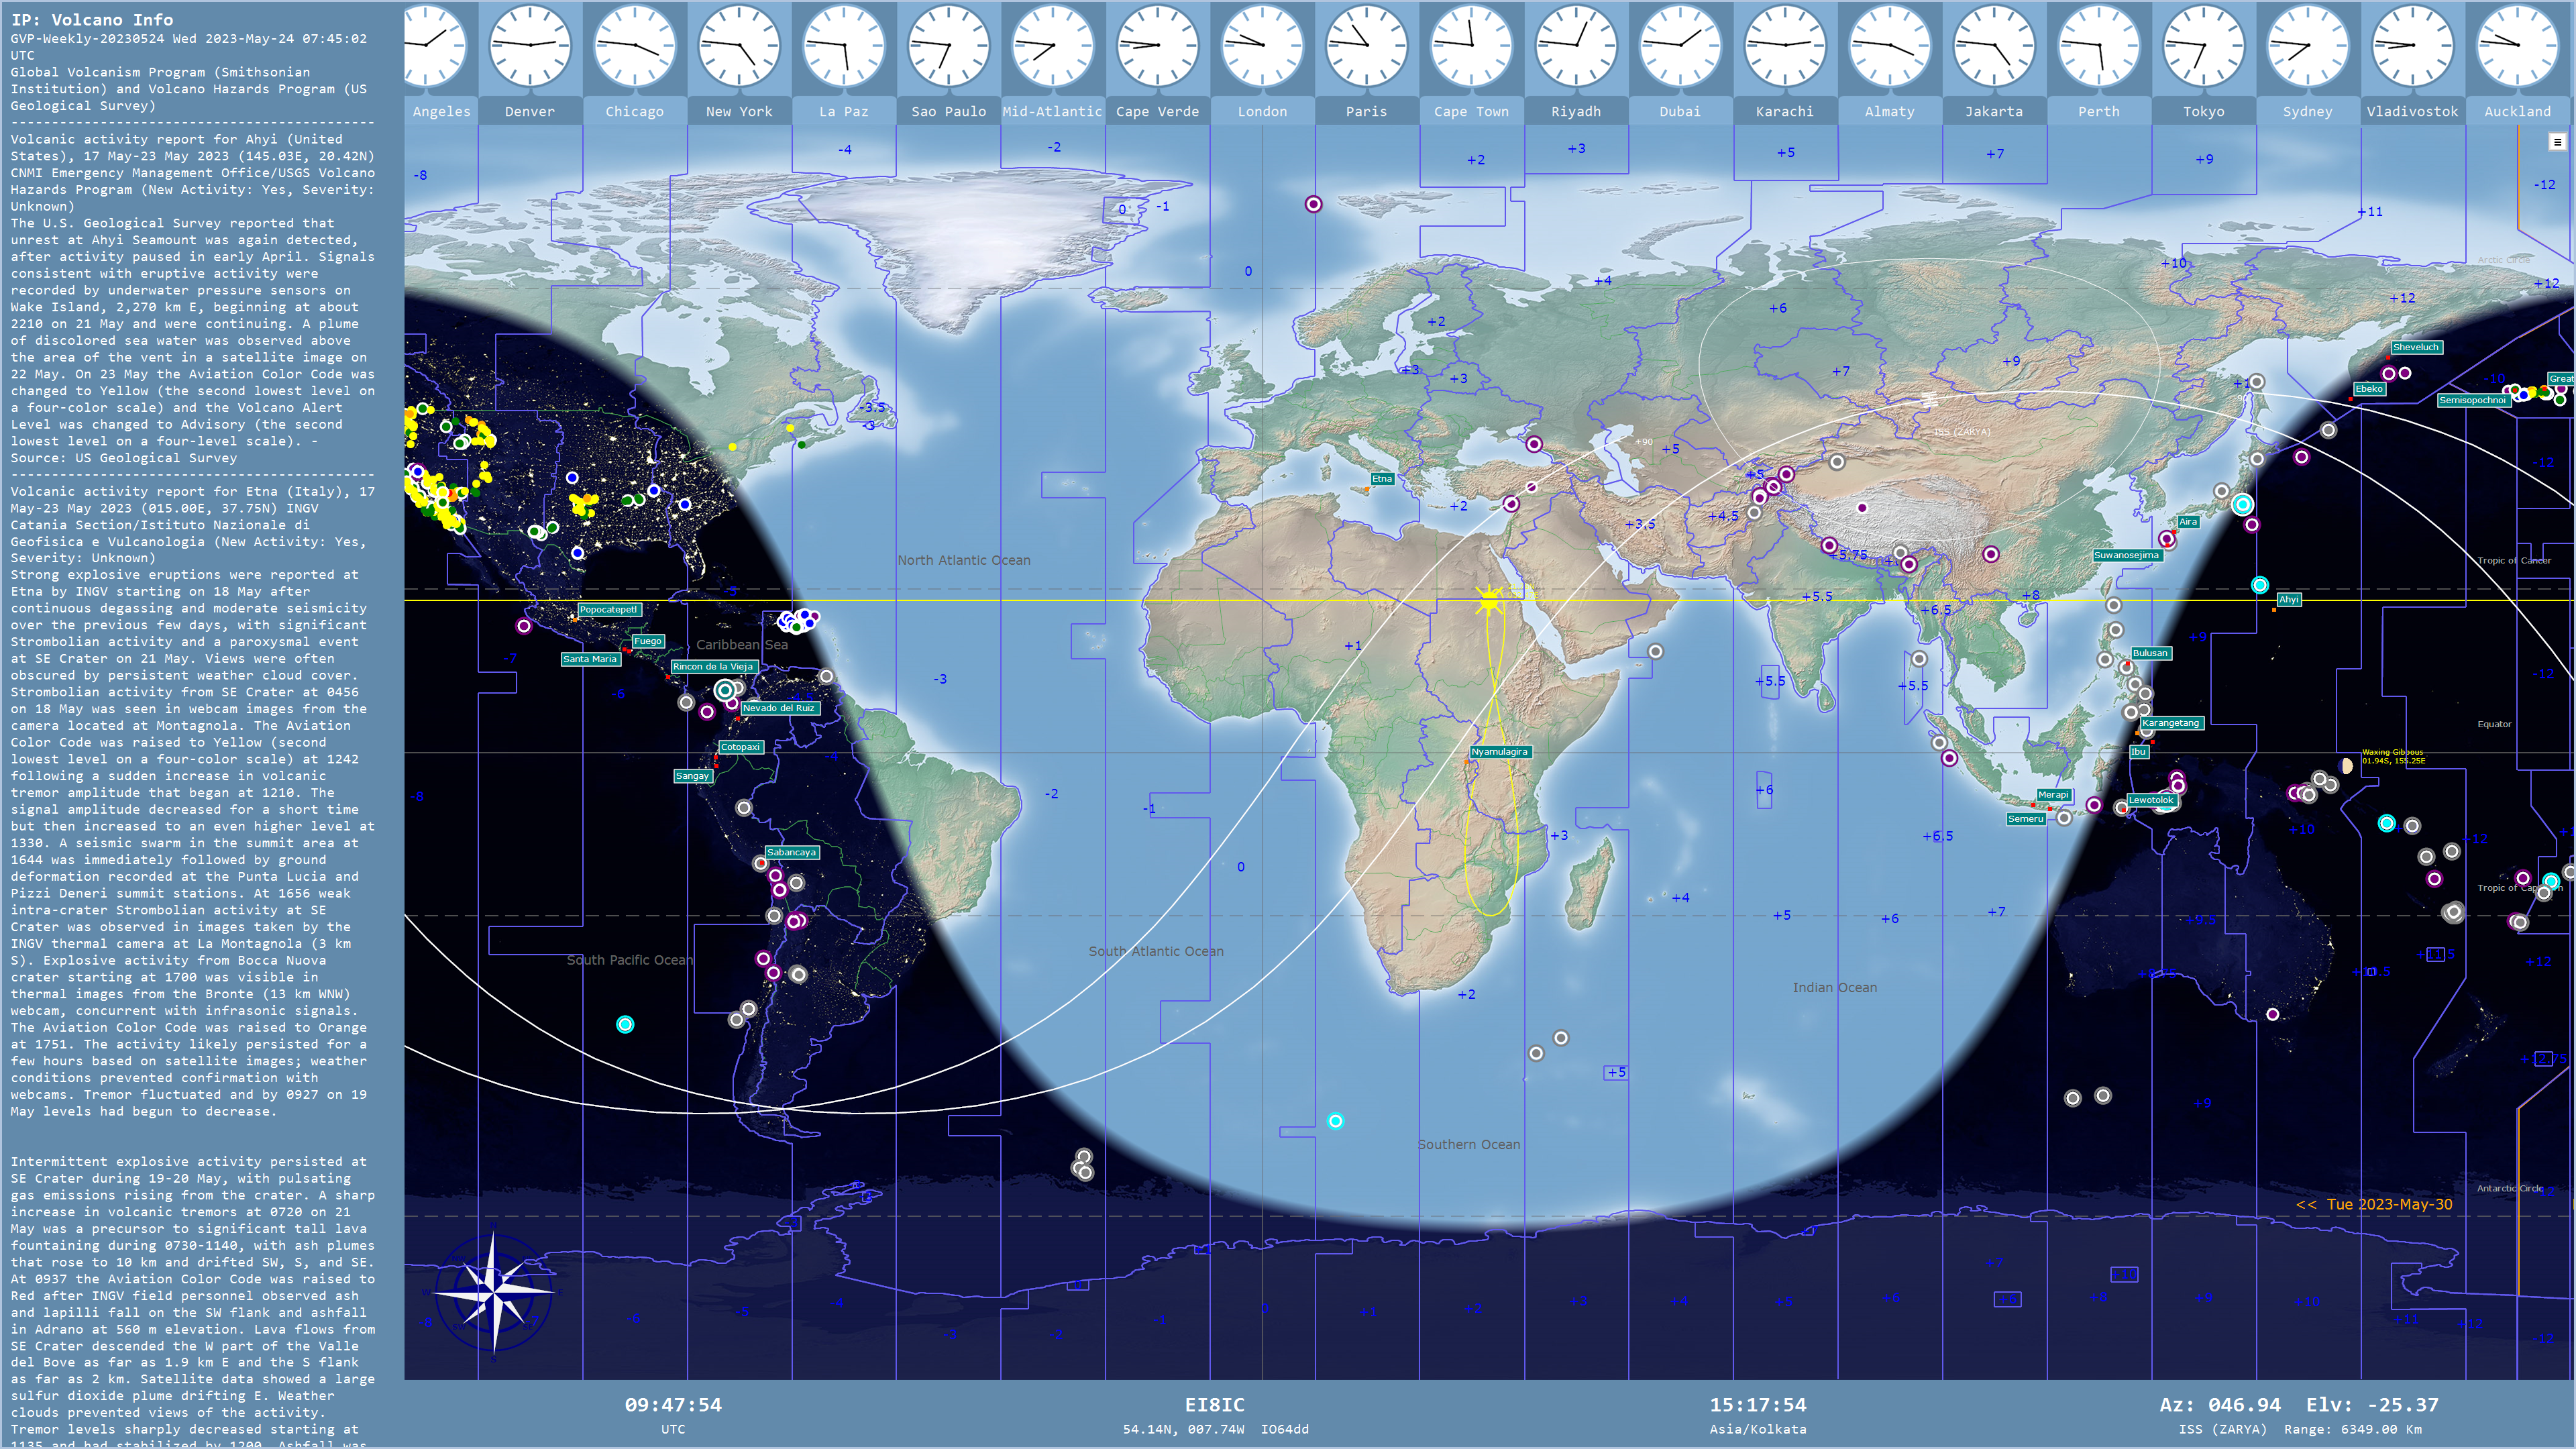
Here we are looking at the Earthquakes and the Volcanos, with the InfoBar: a resizeable section on the left, showing information about volcanic activity. The Info Bar has 17 different pages, and many of the pages have multiple sub-pages that scroll around automatically.
Compare this in HD and 4K Resolution:
4K Map - HD Map - HD Map with Legend
|
 Here we are monitoring a PSK Reporter station, and showing the stations that it is receiving. Rather than swamp the map by showing many hundreds of remote locations, we have chosen instead to show a flag for each received country. You could show the individual stations if you preferred, and filter by mode, band. You can choose points with lines, labels, each with many options to make the map look the way you like it. In the left-hand 'Info Bar' we are looking at recently downloaded Propagation Images. Each can be expanded in the local image-viewer.
|
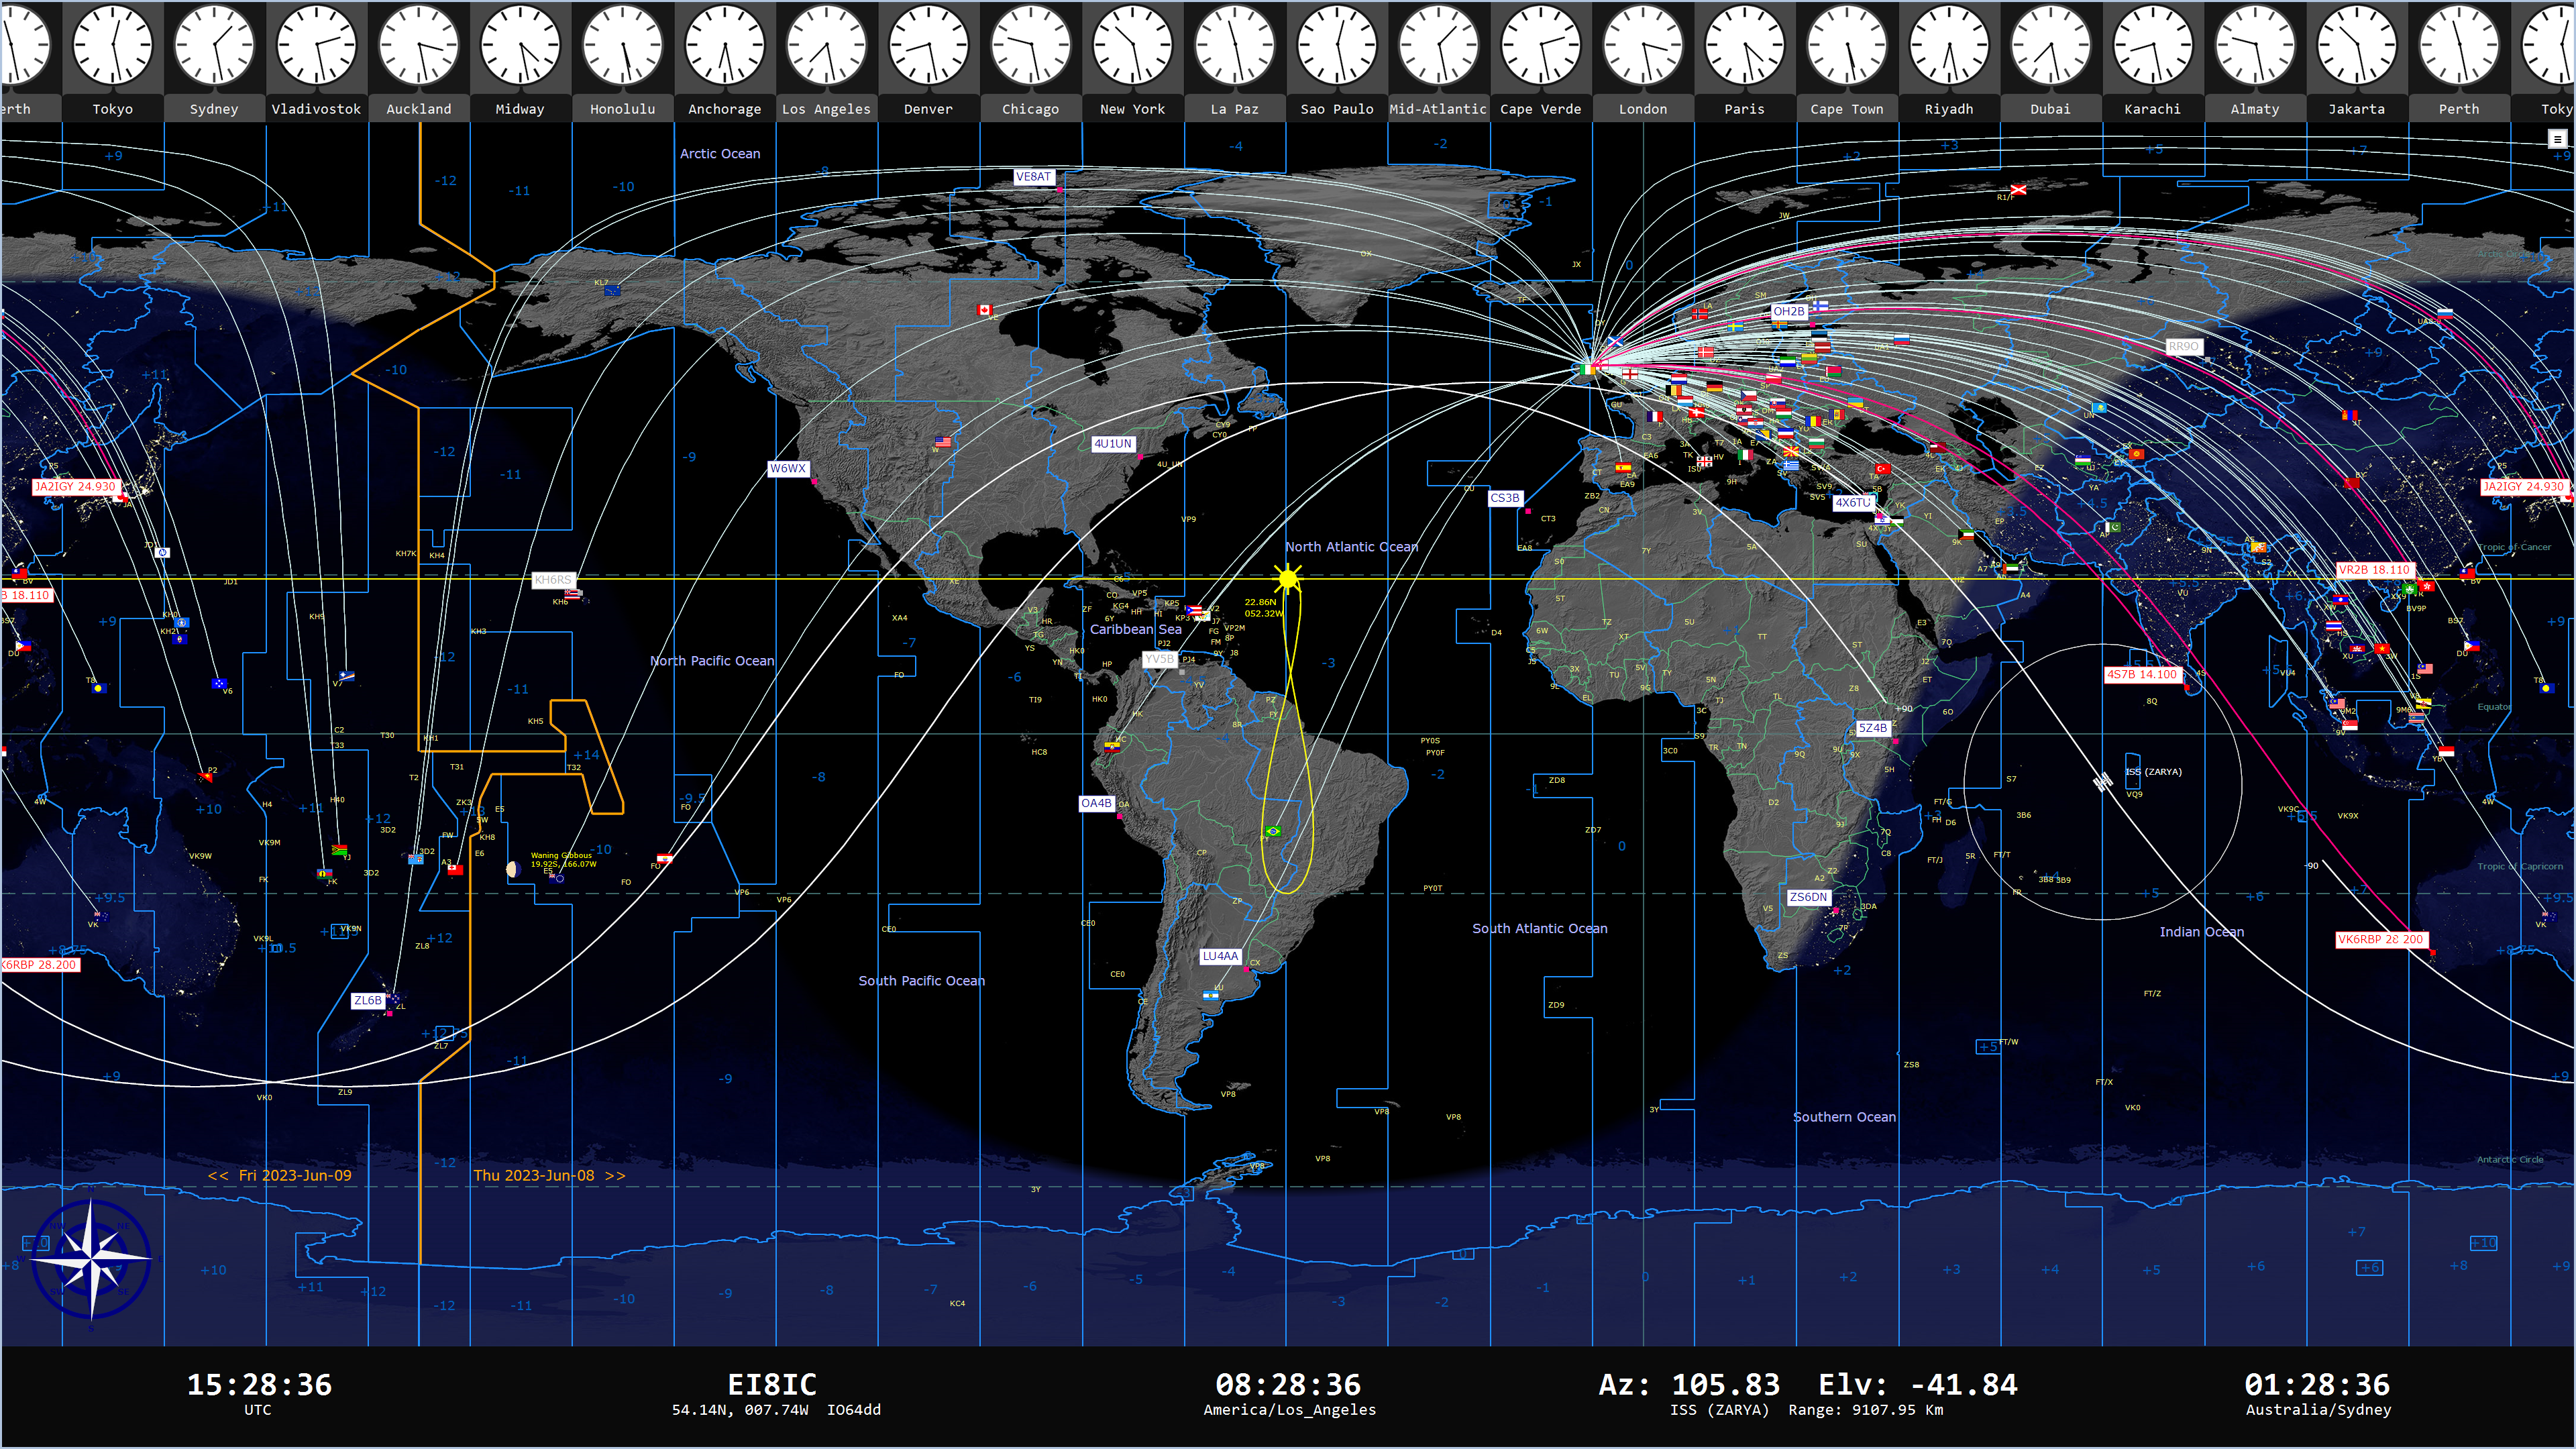
You can load 3 separate Amateur Radio Logs, in Cabrillo or ADIF format. Again, we have chosen to see a flag for each country in the log, rather than a marker or label for each callsign. If your imported log does not have positions for each QSO, they will be obtained automatically in a variety of different ways. Compare Basemaps:
HD Map 1 - HD Map 2 - HD Map 3 - HD Map 4
|
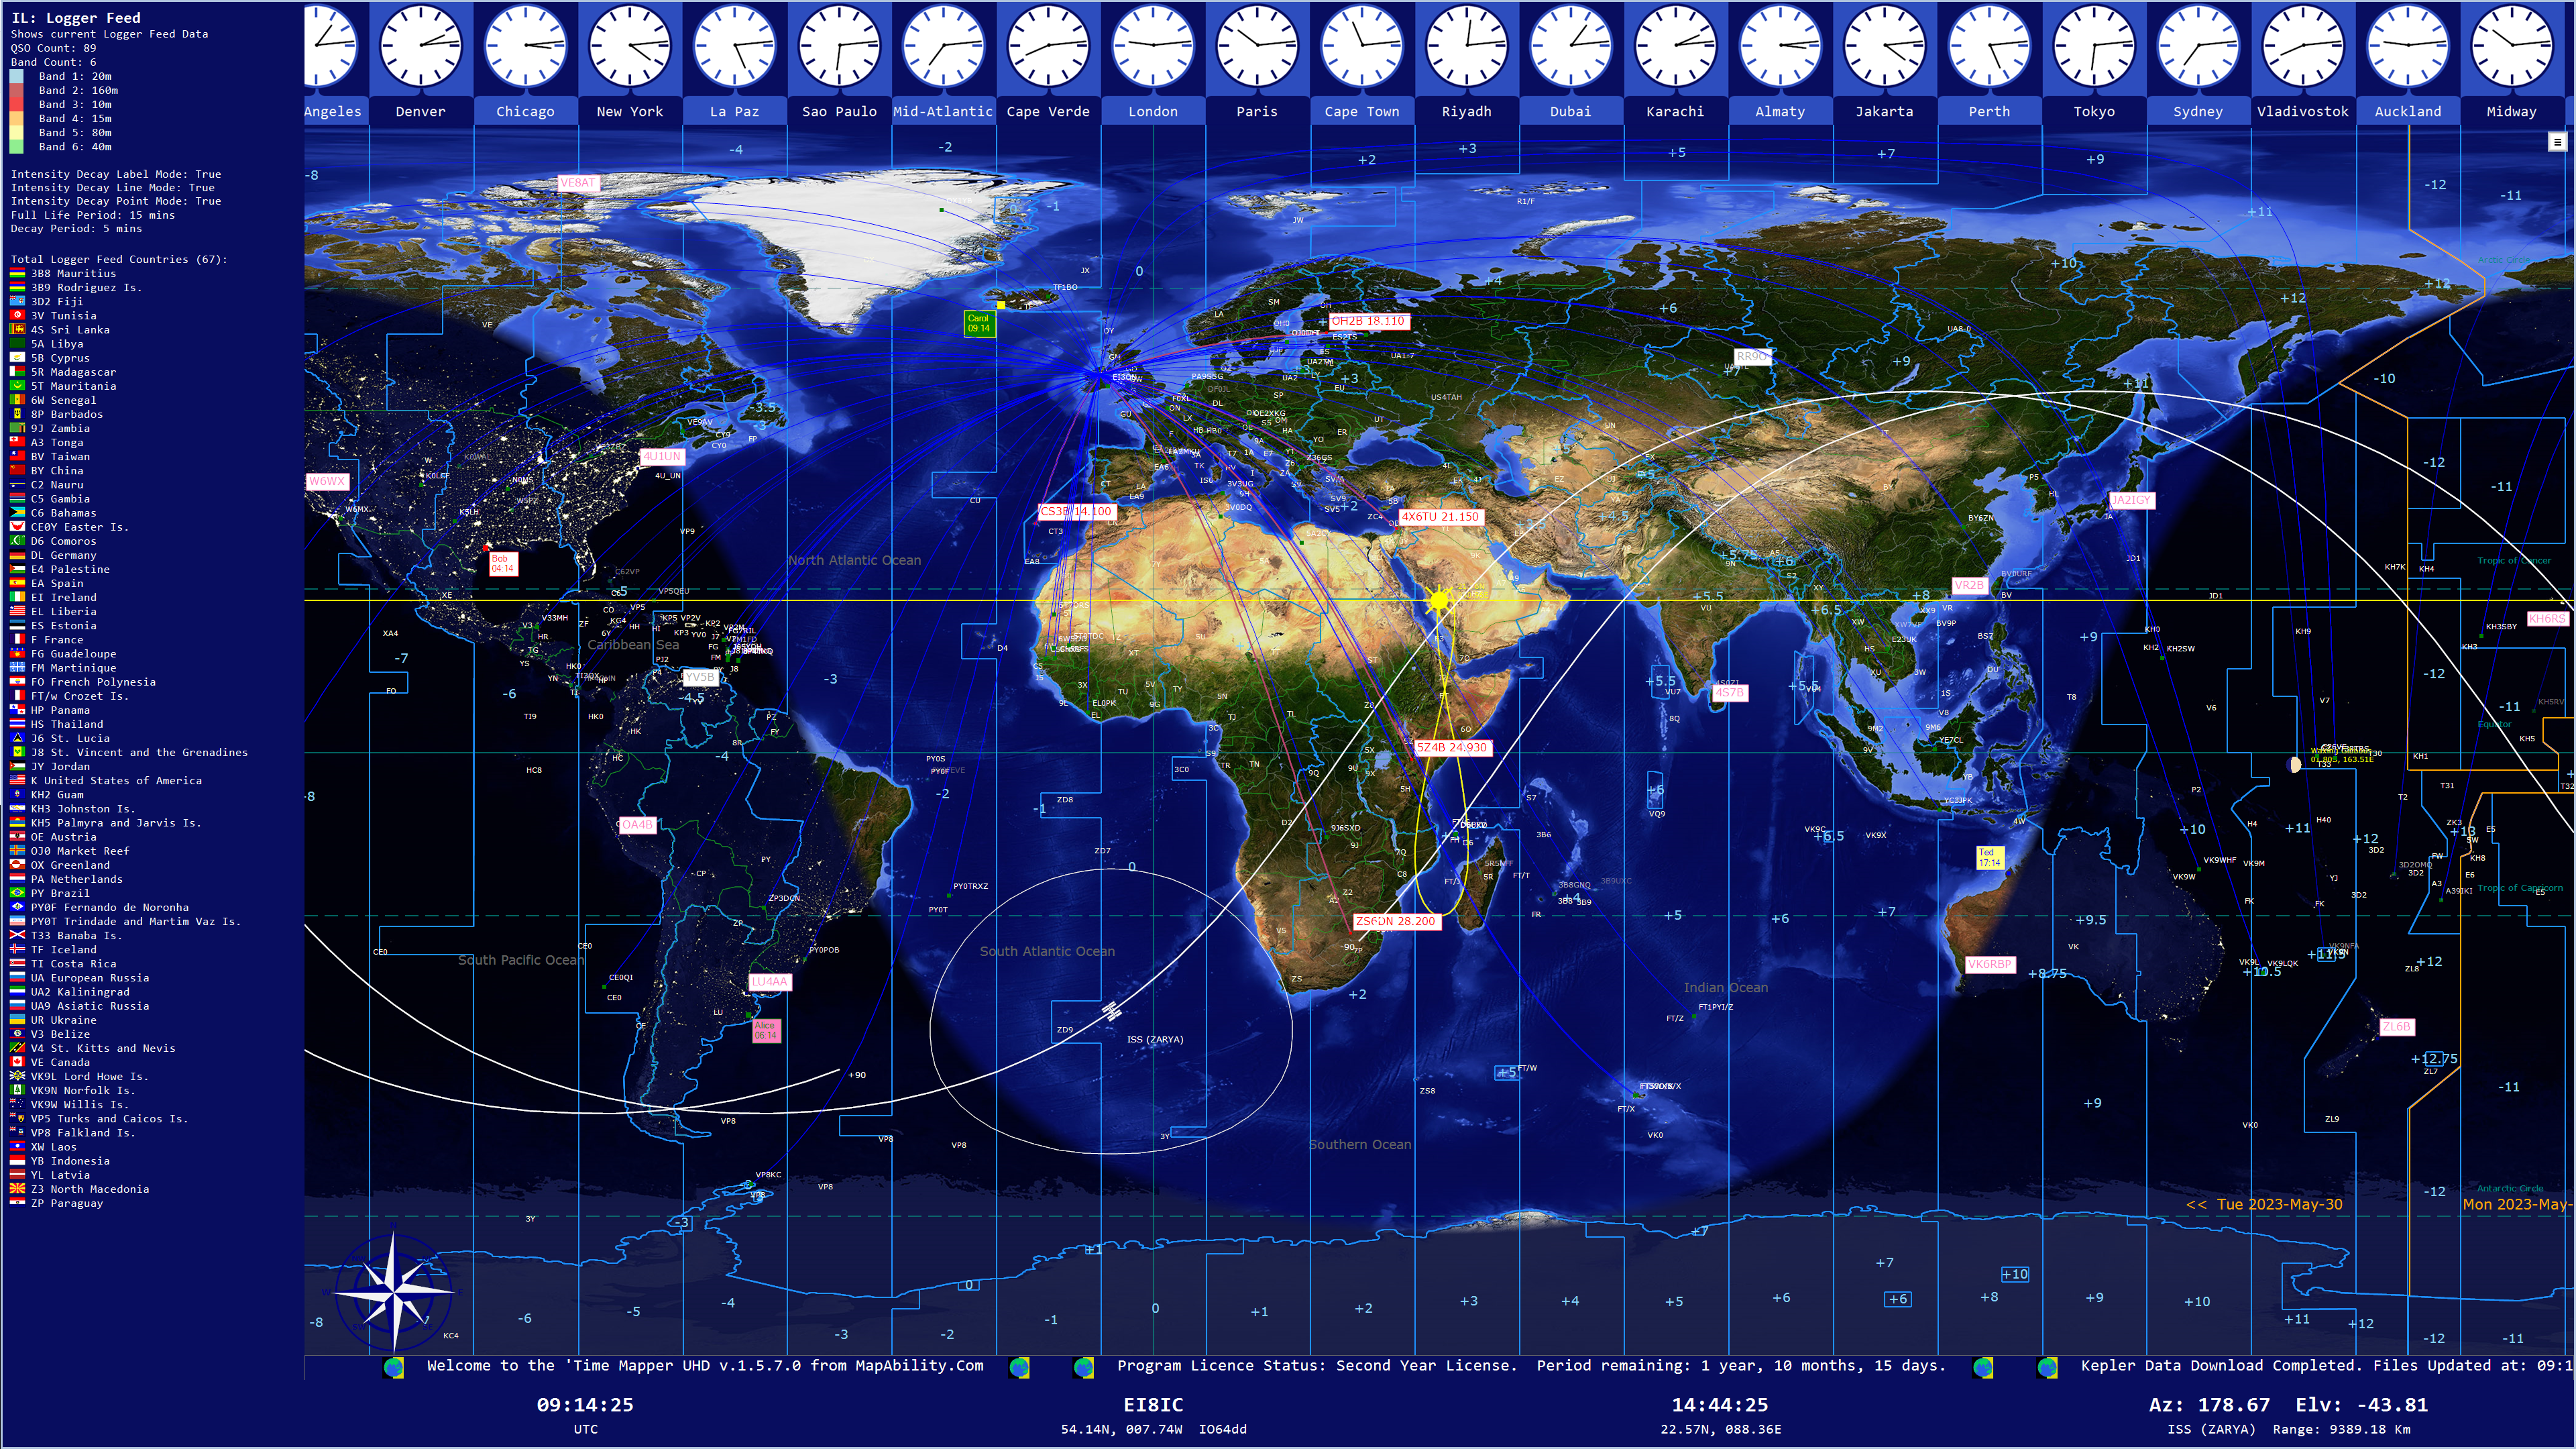
One of the most exciting features is the Logger Feed, which receives live QSOs from your N1MM logger as you make them, and shows them on the map, with log info in the left-hand Info Bar. Intensity Decay is switched on, so QSOs fade after a pre-determined time. You can test the Logger Feed with the inbuilt UDP Simulator, which generates QSOs faster than CQWW. Some HD examples with different Zone layers:
HD Map 1 - HD Map 2 - HD Map 3
|
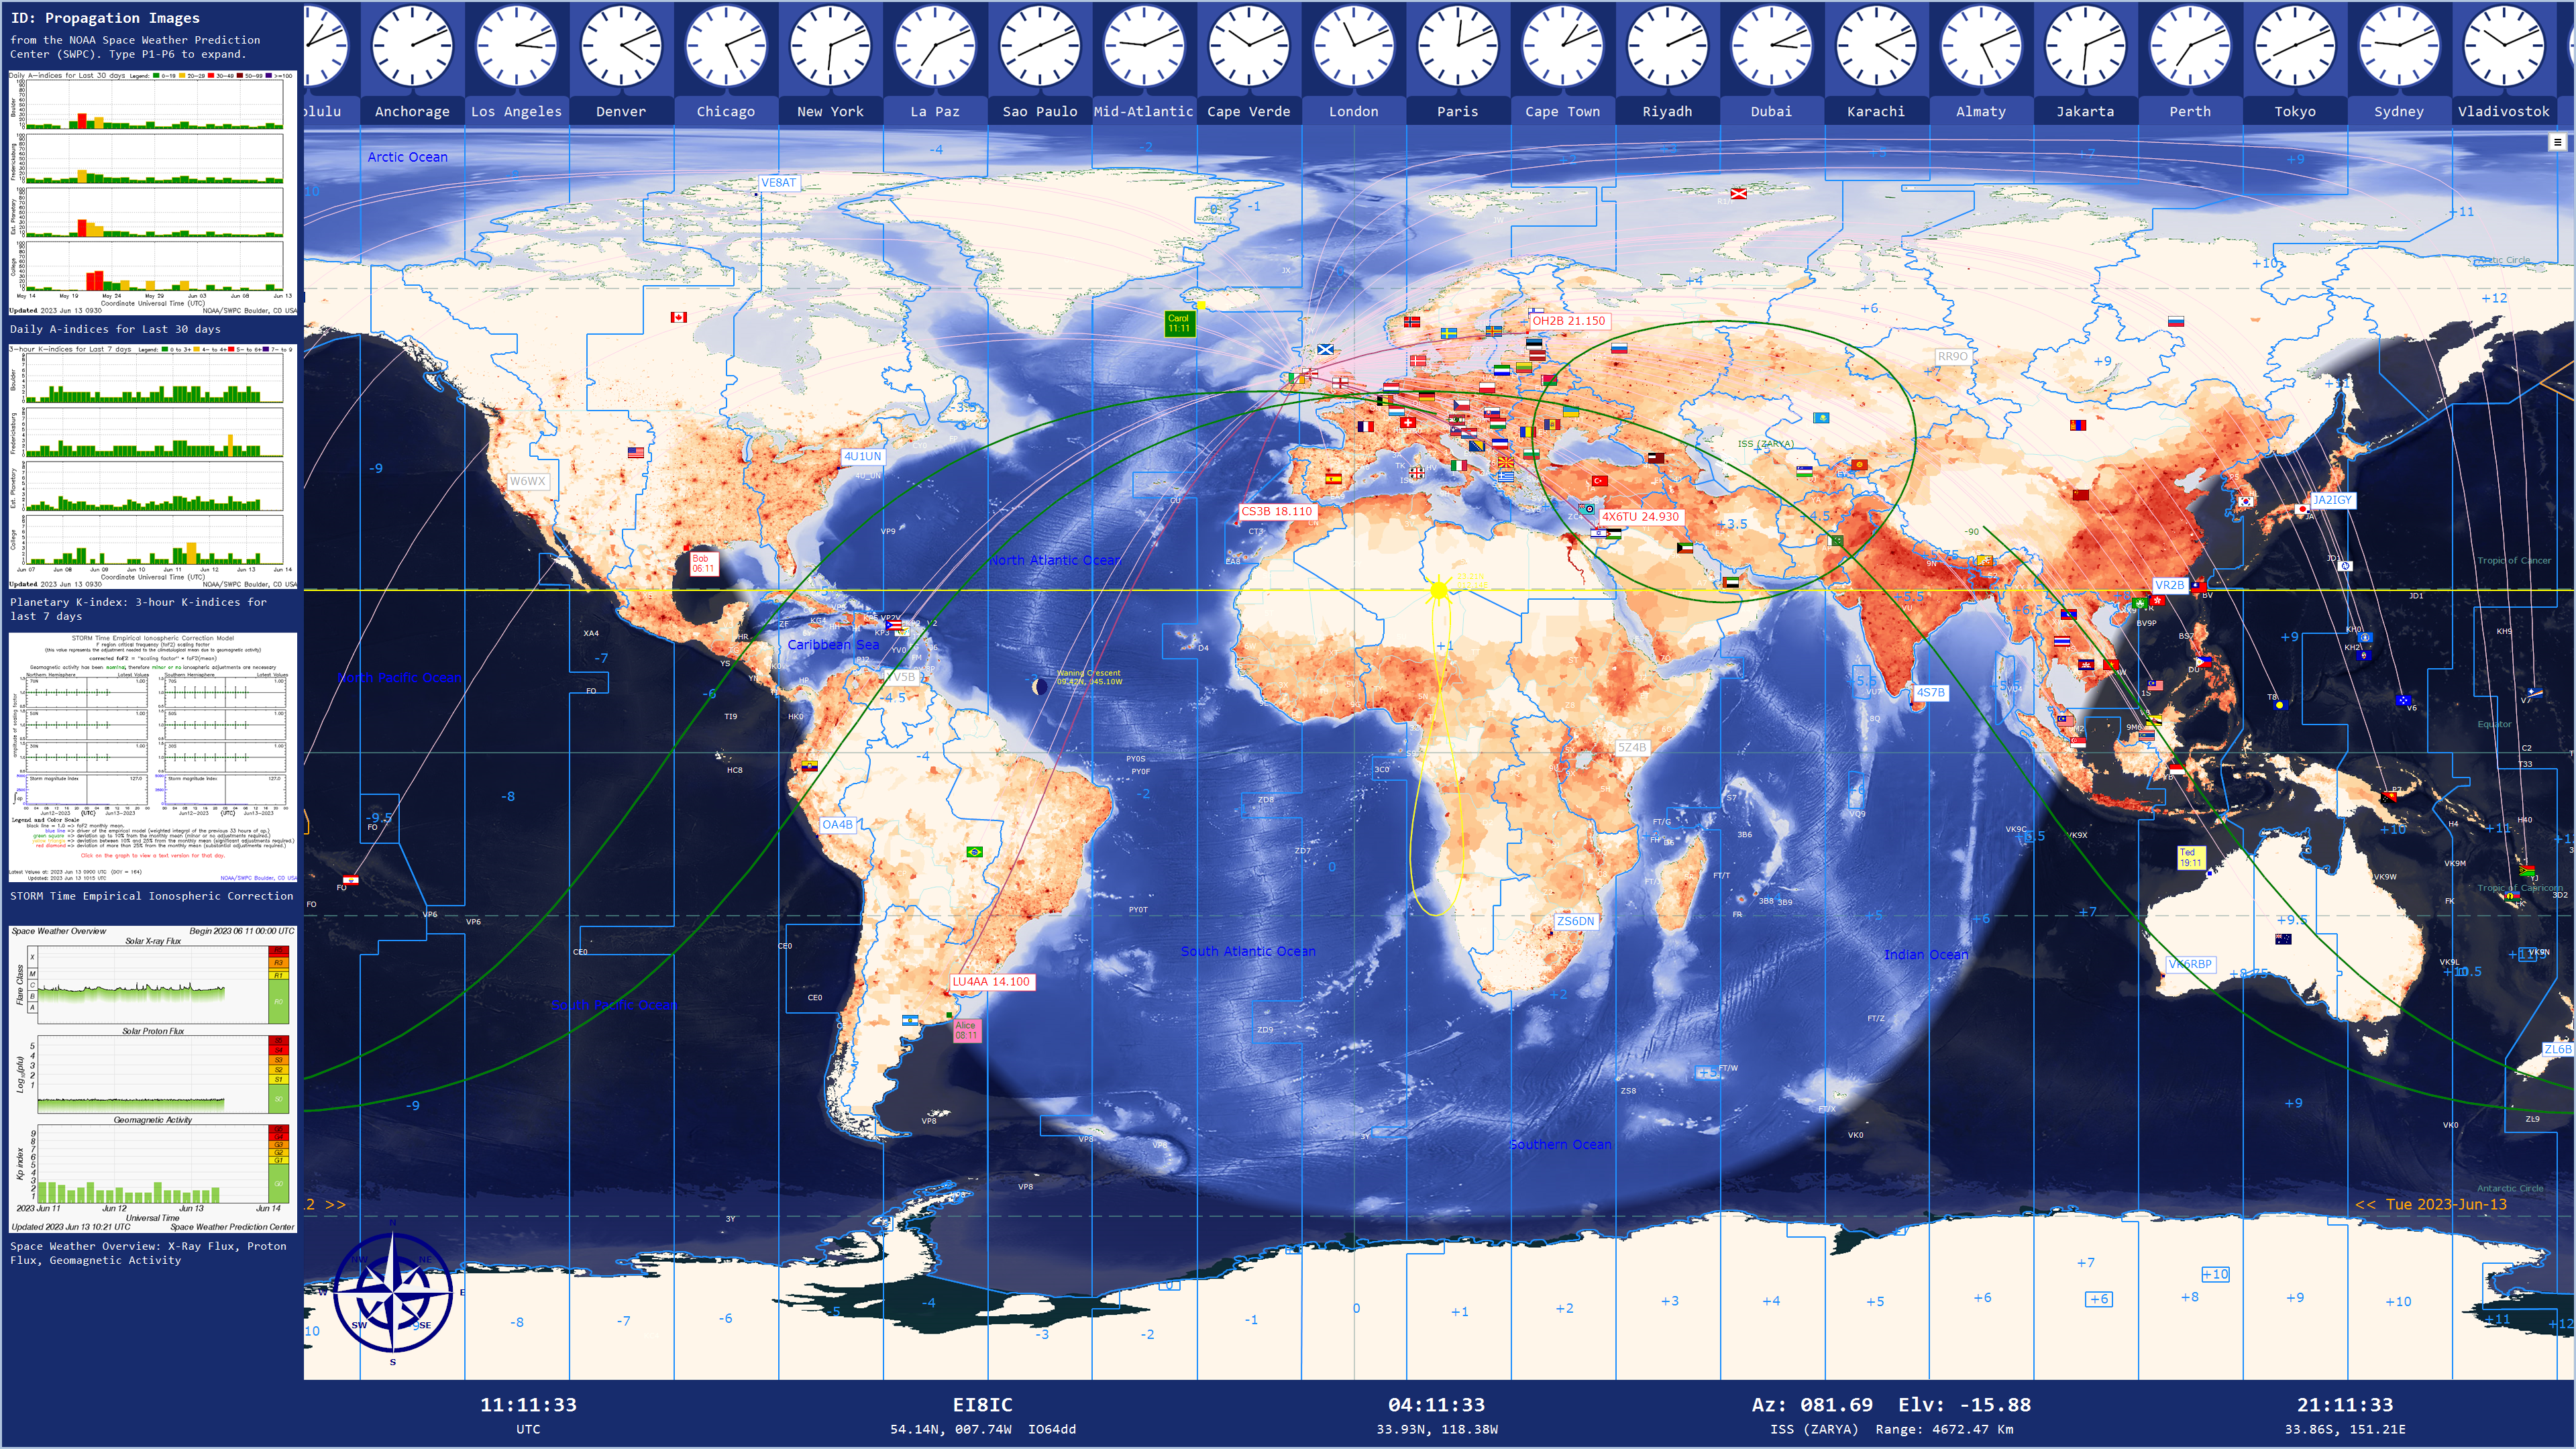
There are 60 different map-layers, each of which can be stacked in a chosen order on any of the 25 base maps. There are Raster as well as Vector layers. Here we see the Population Density raster-layer covering the land, but not the ocean. |
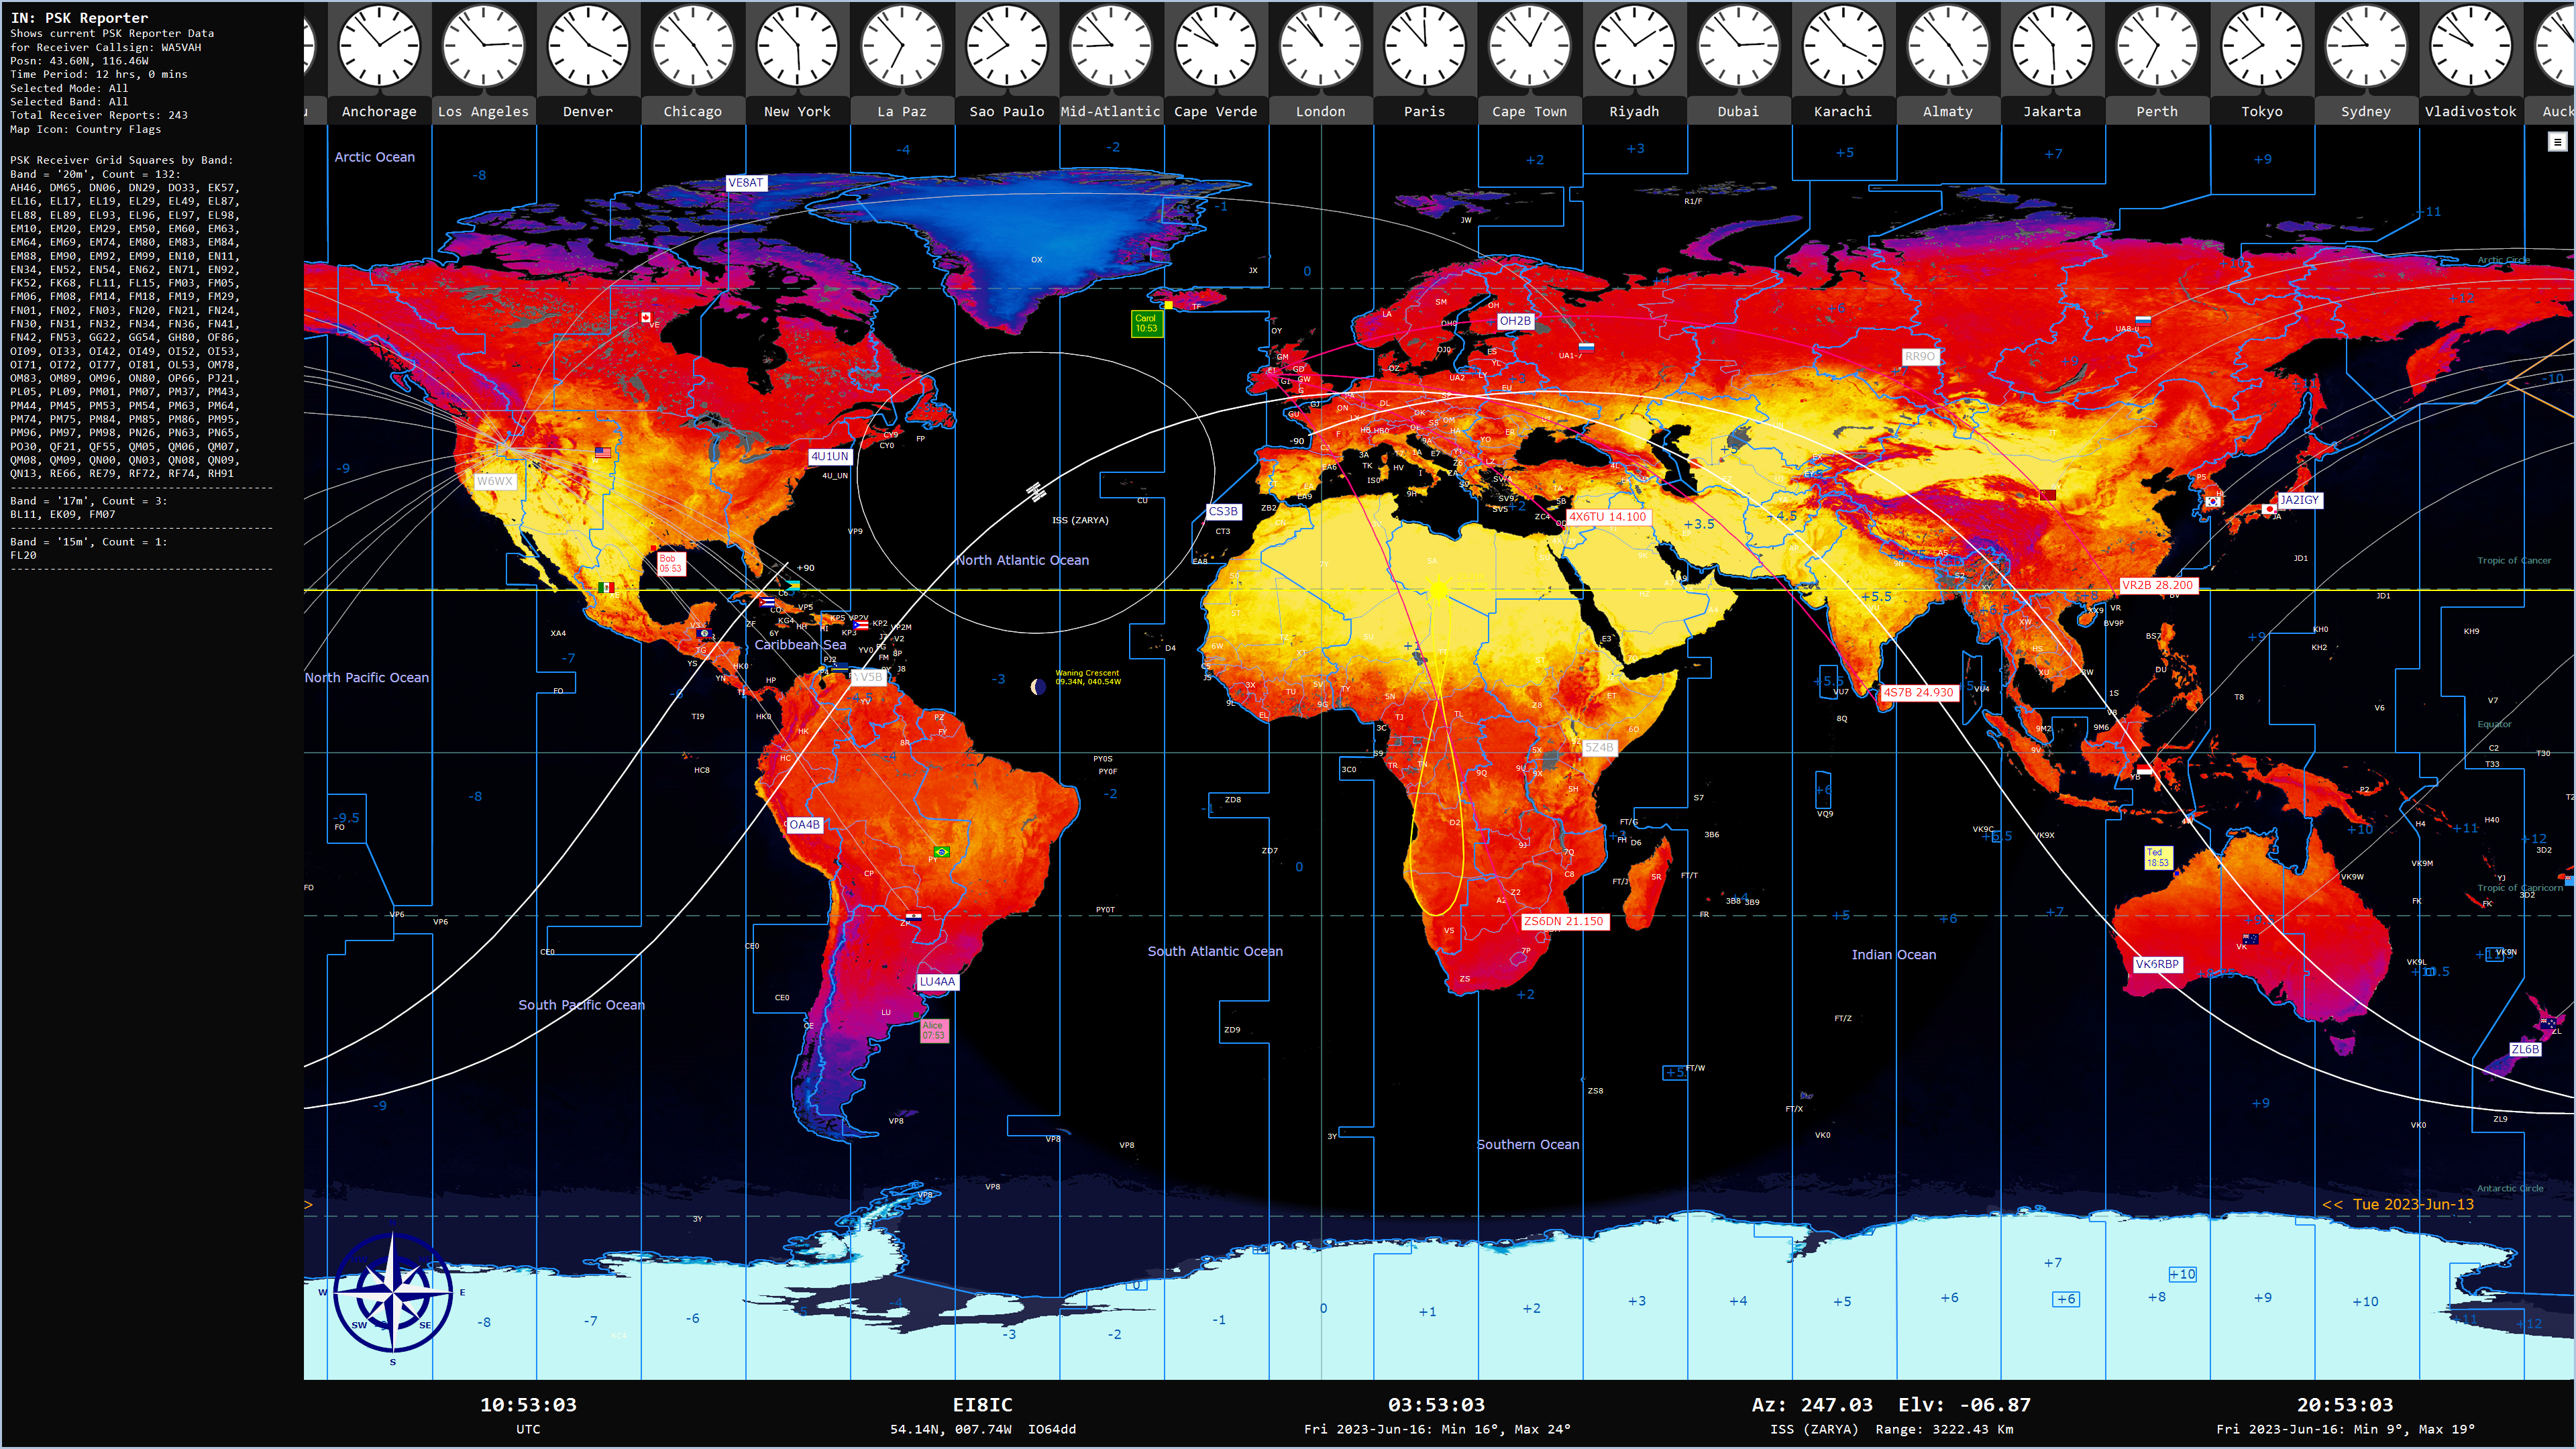
The Daytime Temperature is another raster layer. Here we have chosen values for June. Also showing is the PSK Reporter layer, with a check on total Grid Squares contacted. Yes, you can plot grid squares on the map, too. |
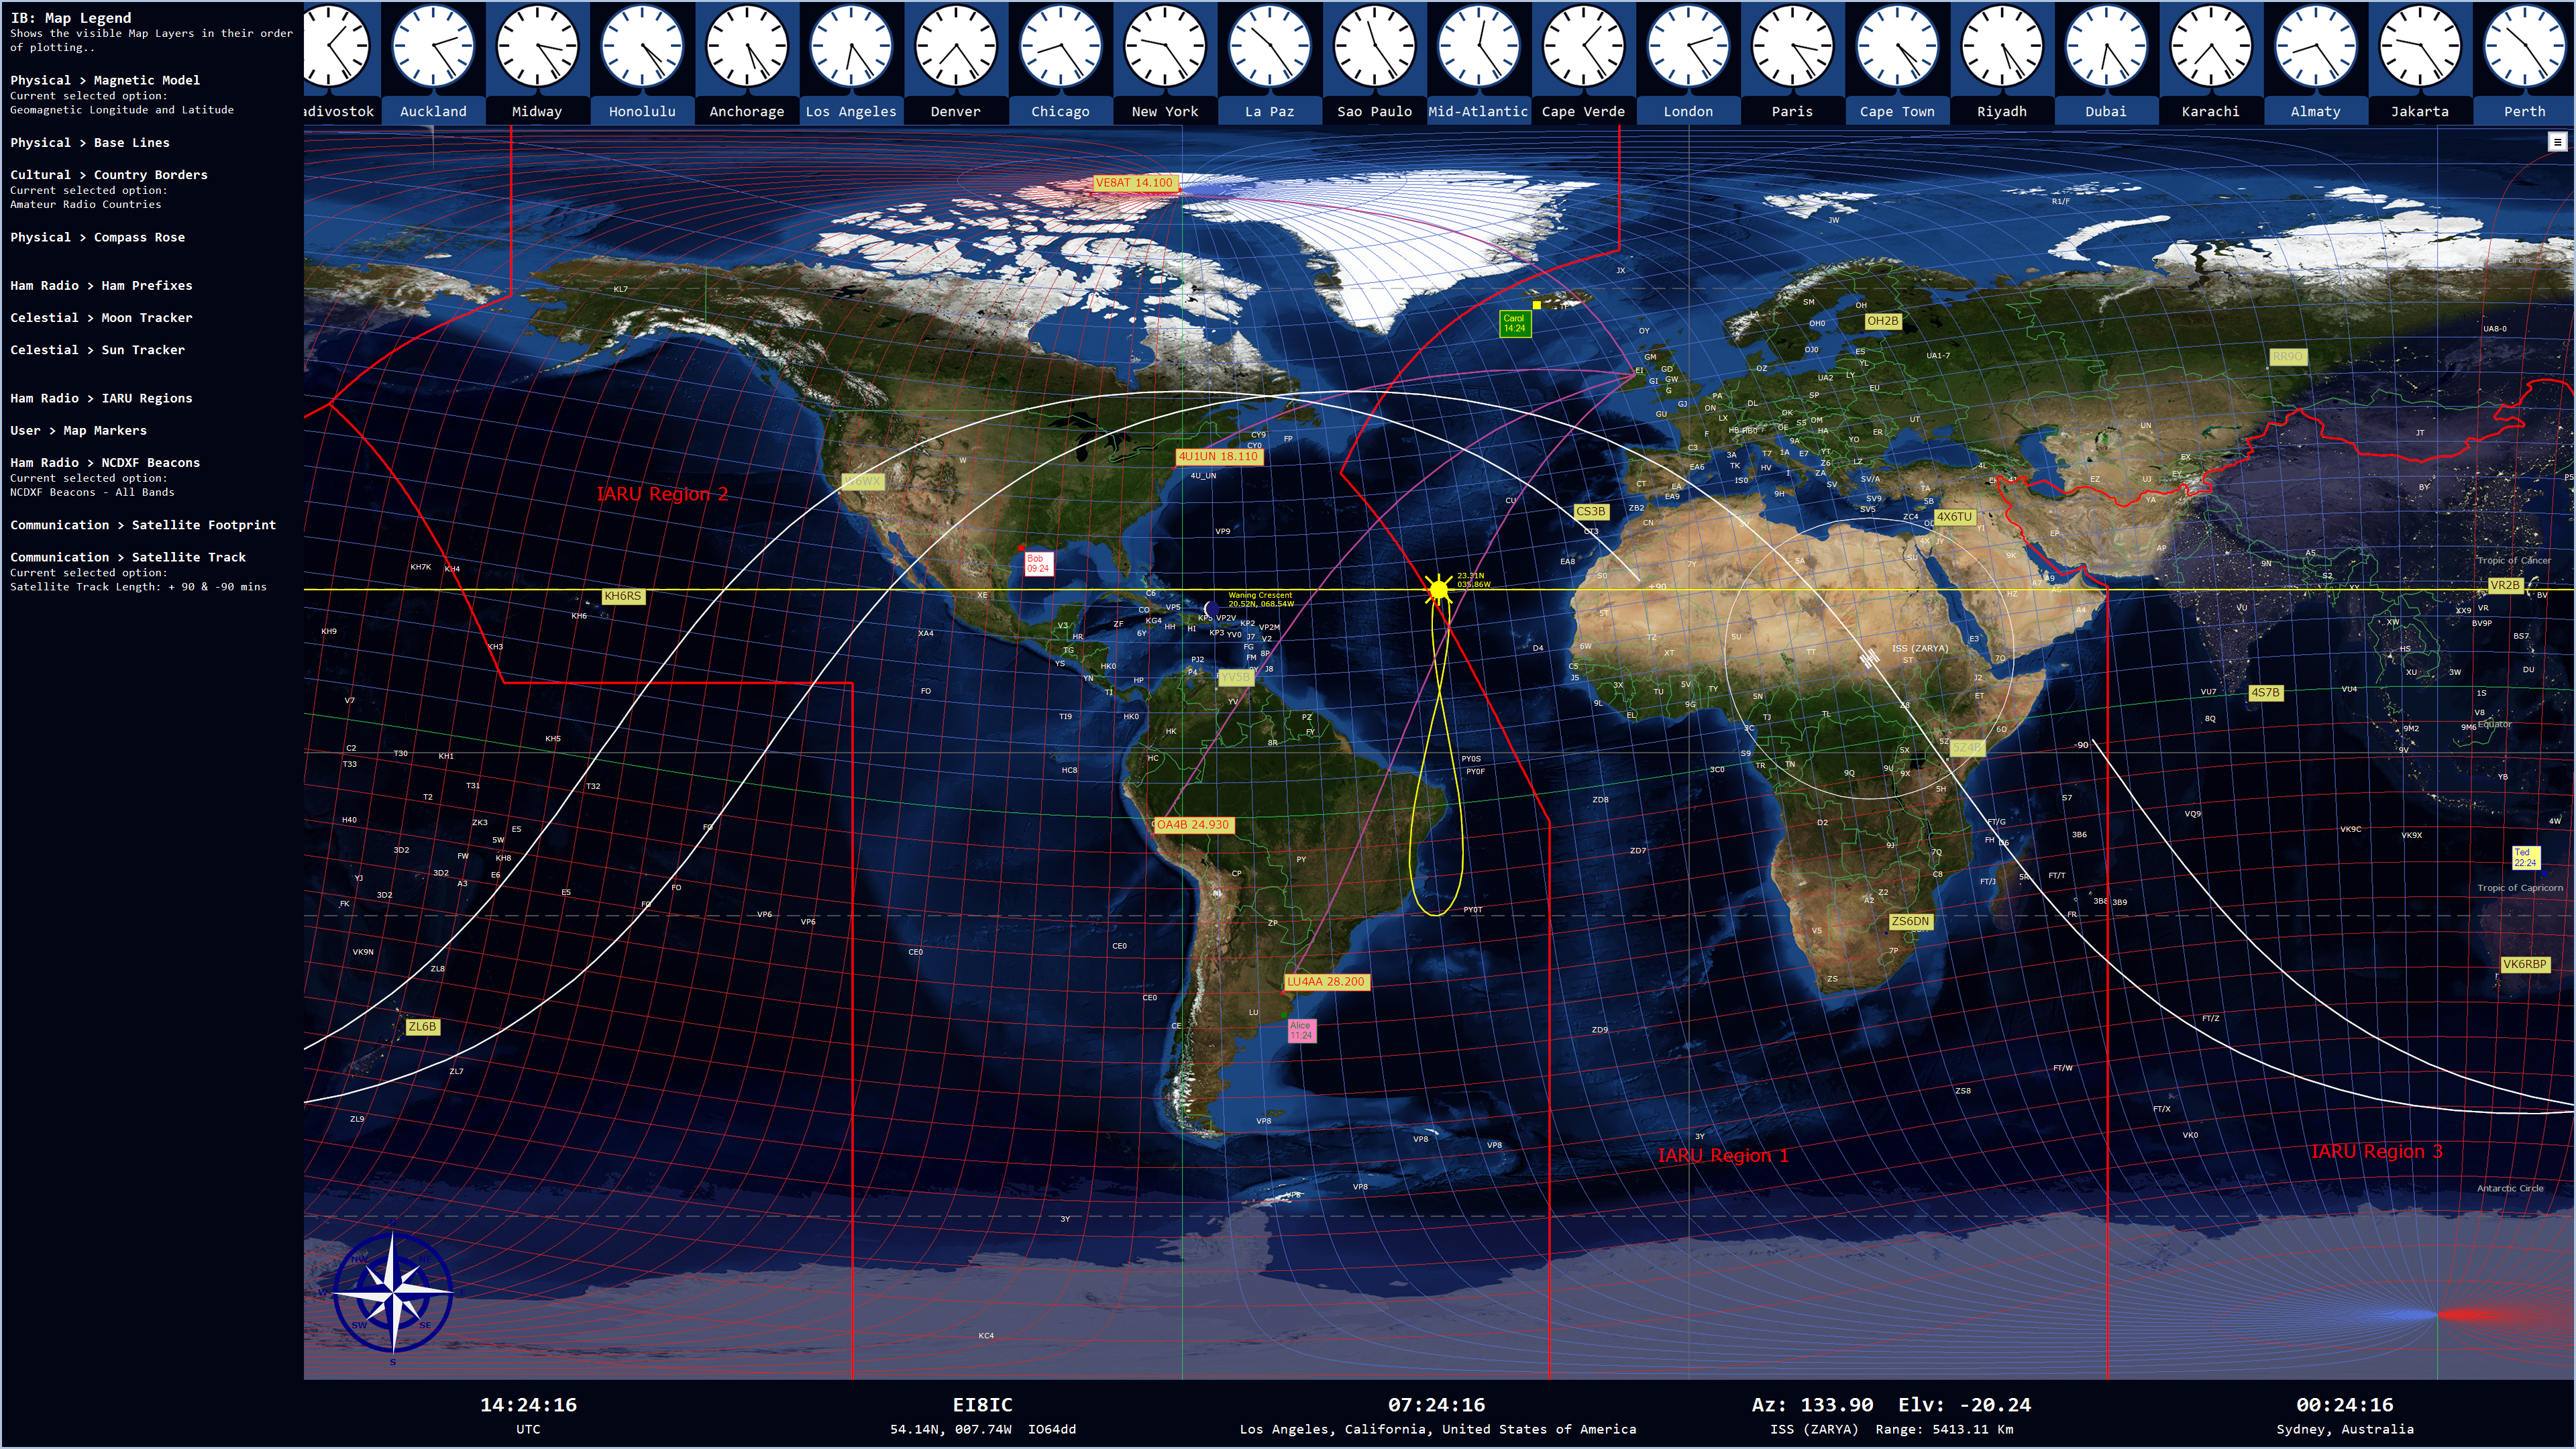
Did you know where the Magnetic North Pole is? Here we see the Magnetic Model, and the pole is very close to the NCDXF Beacon 'VE8AT', in IARU Region 2. Look how close the sun position is to the top of the Analemma. As June ends, it will start its track down again, to reach the Tropic of Capricorn in December. |
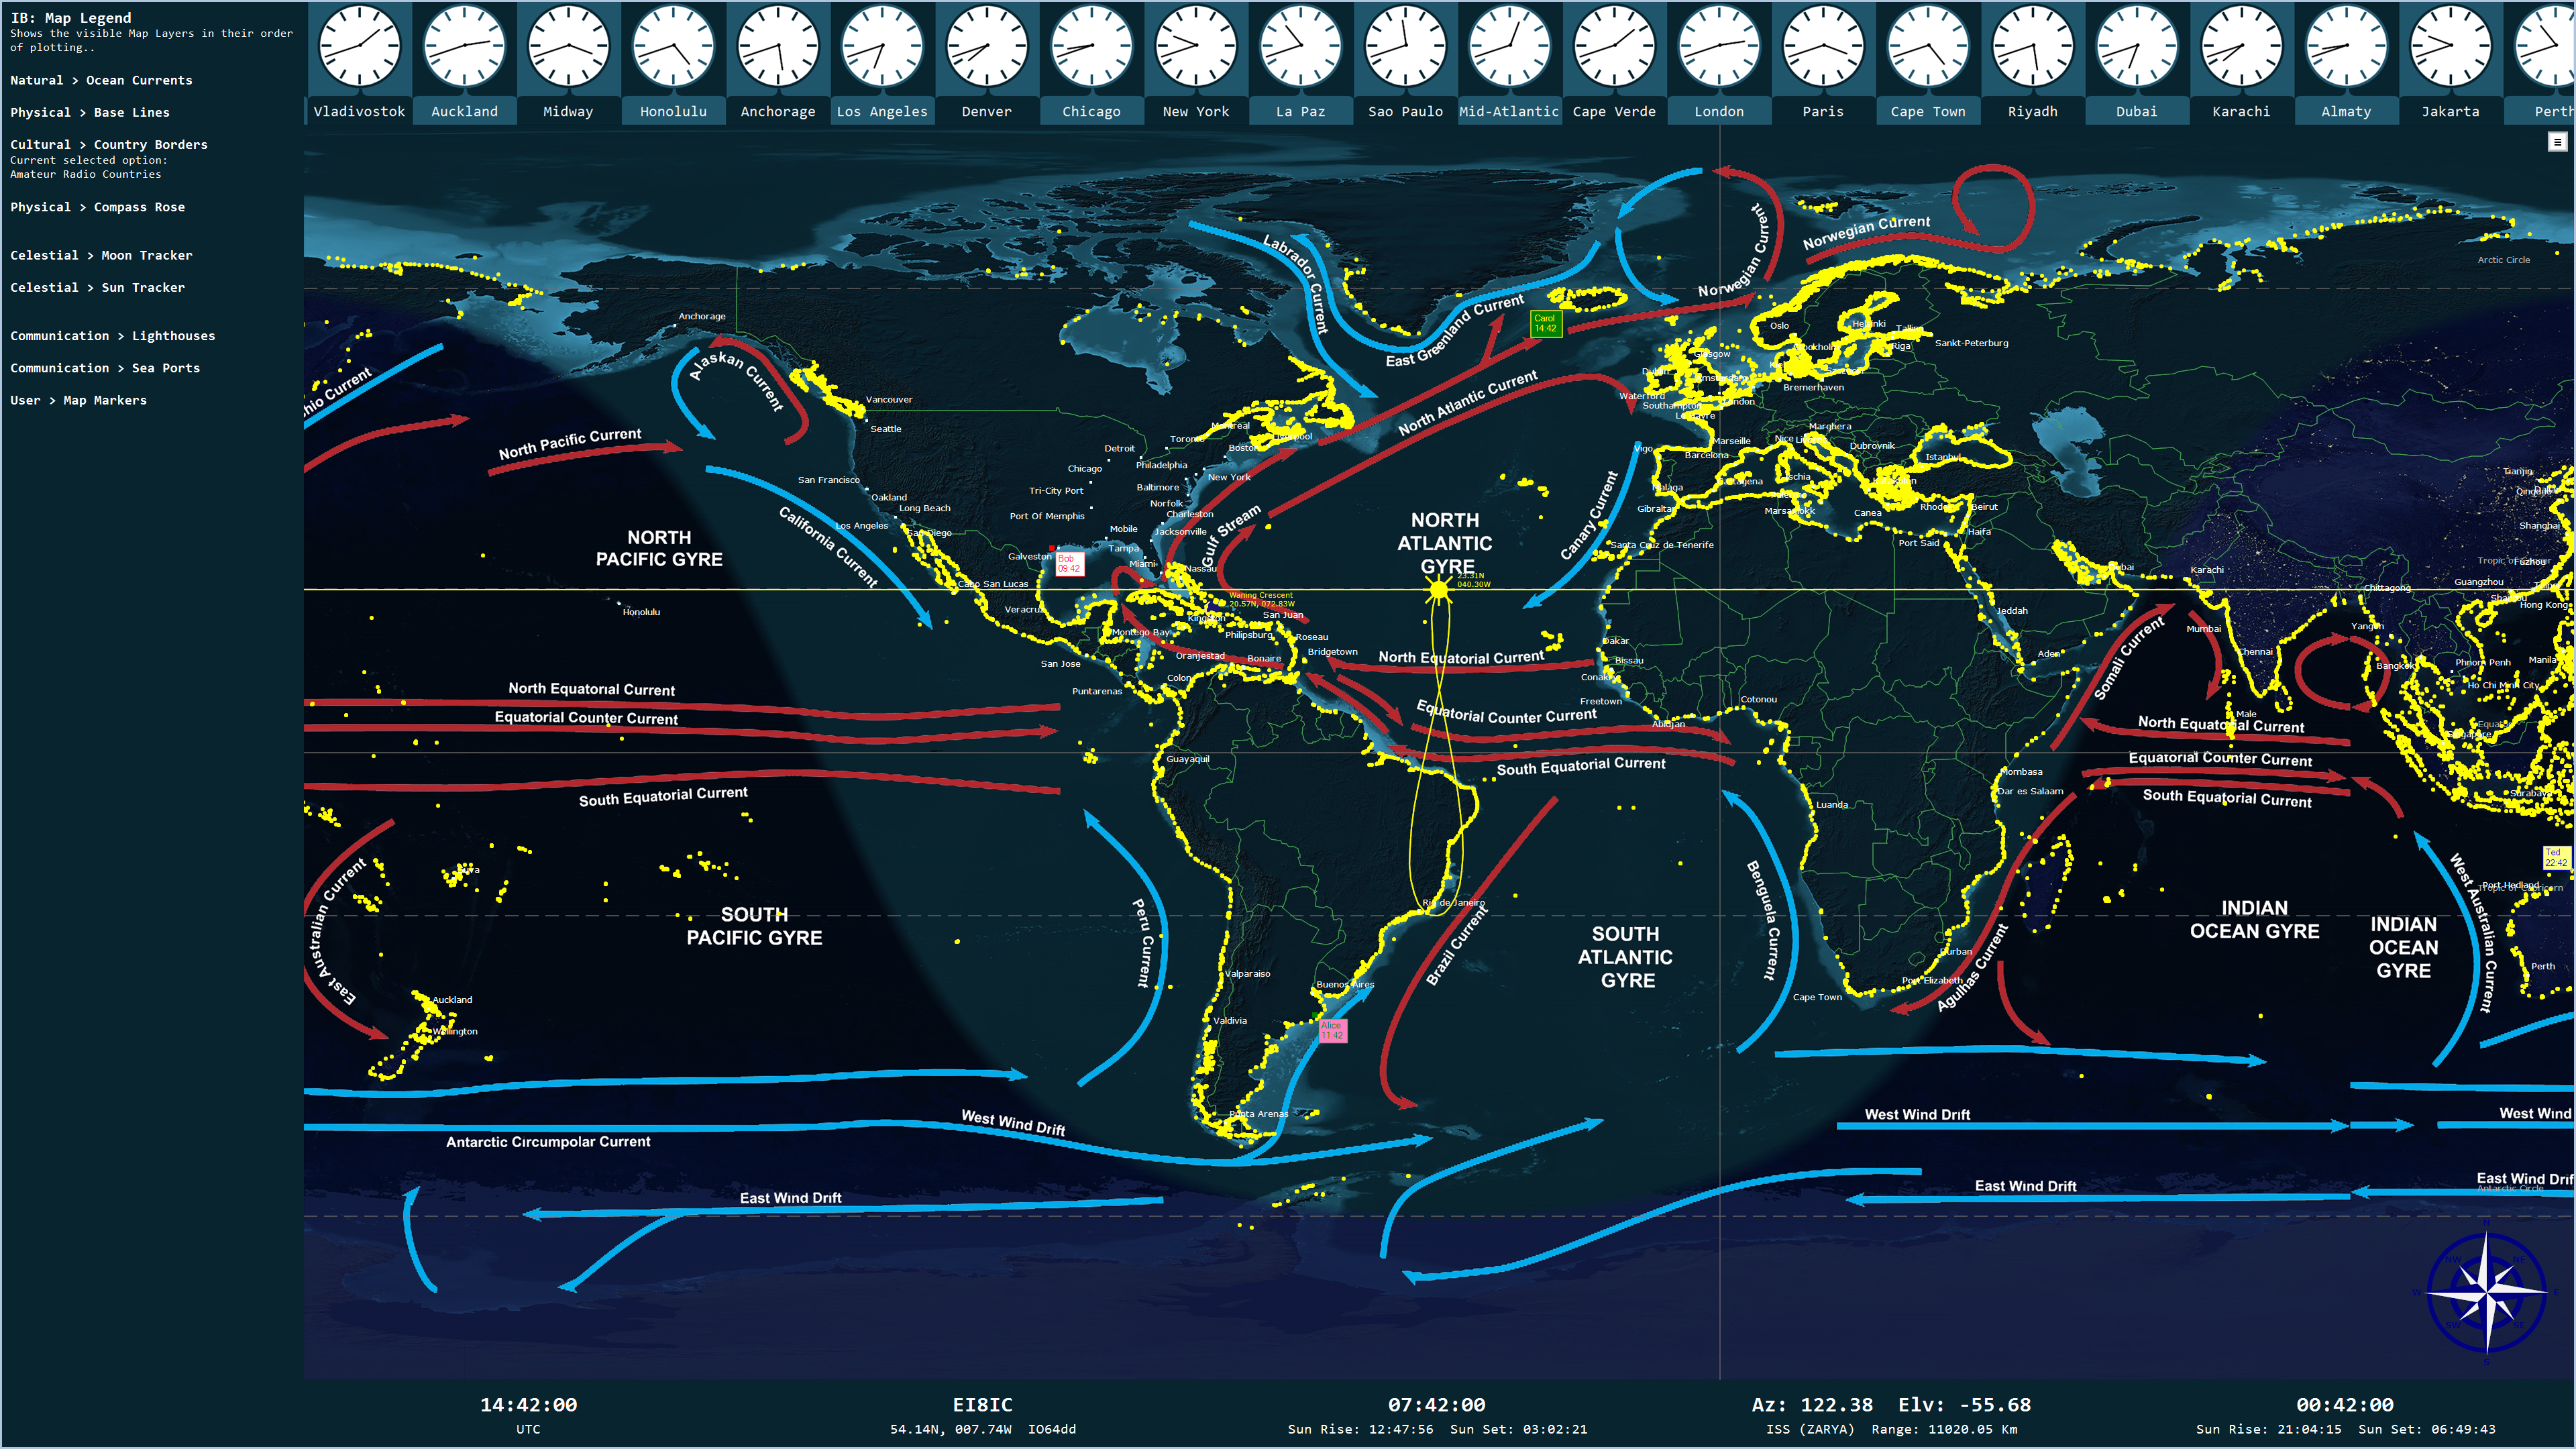
A nautical theme now. Ocean Currents, major sea-ports, plus 40,000 of the world's major lighthouses.
|
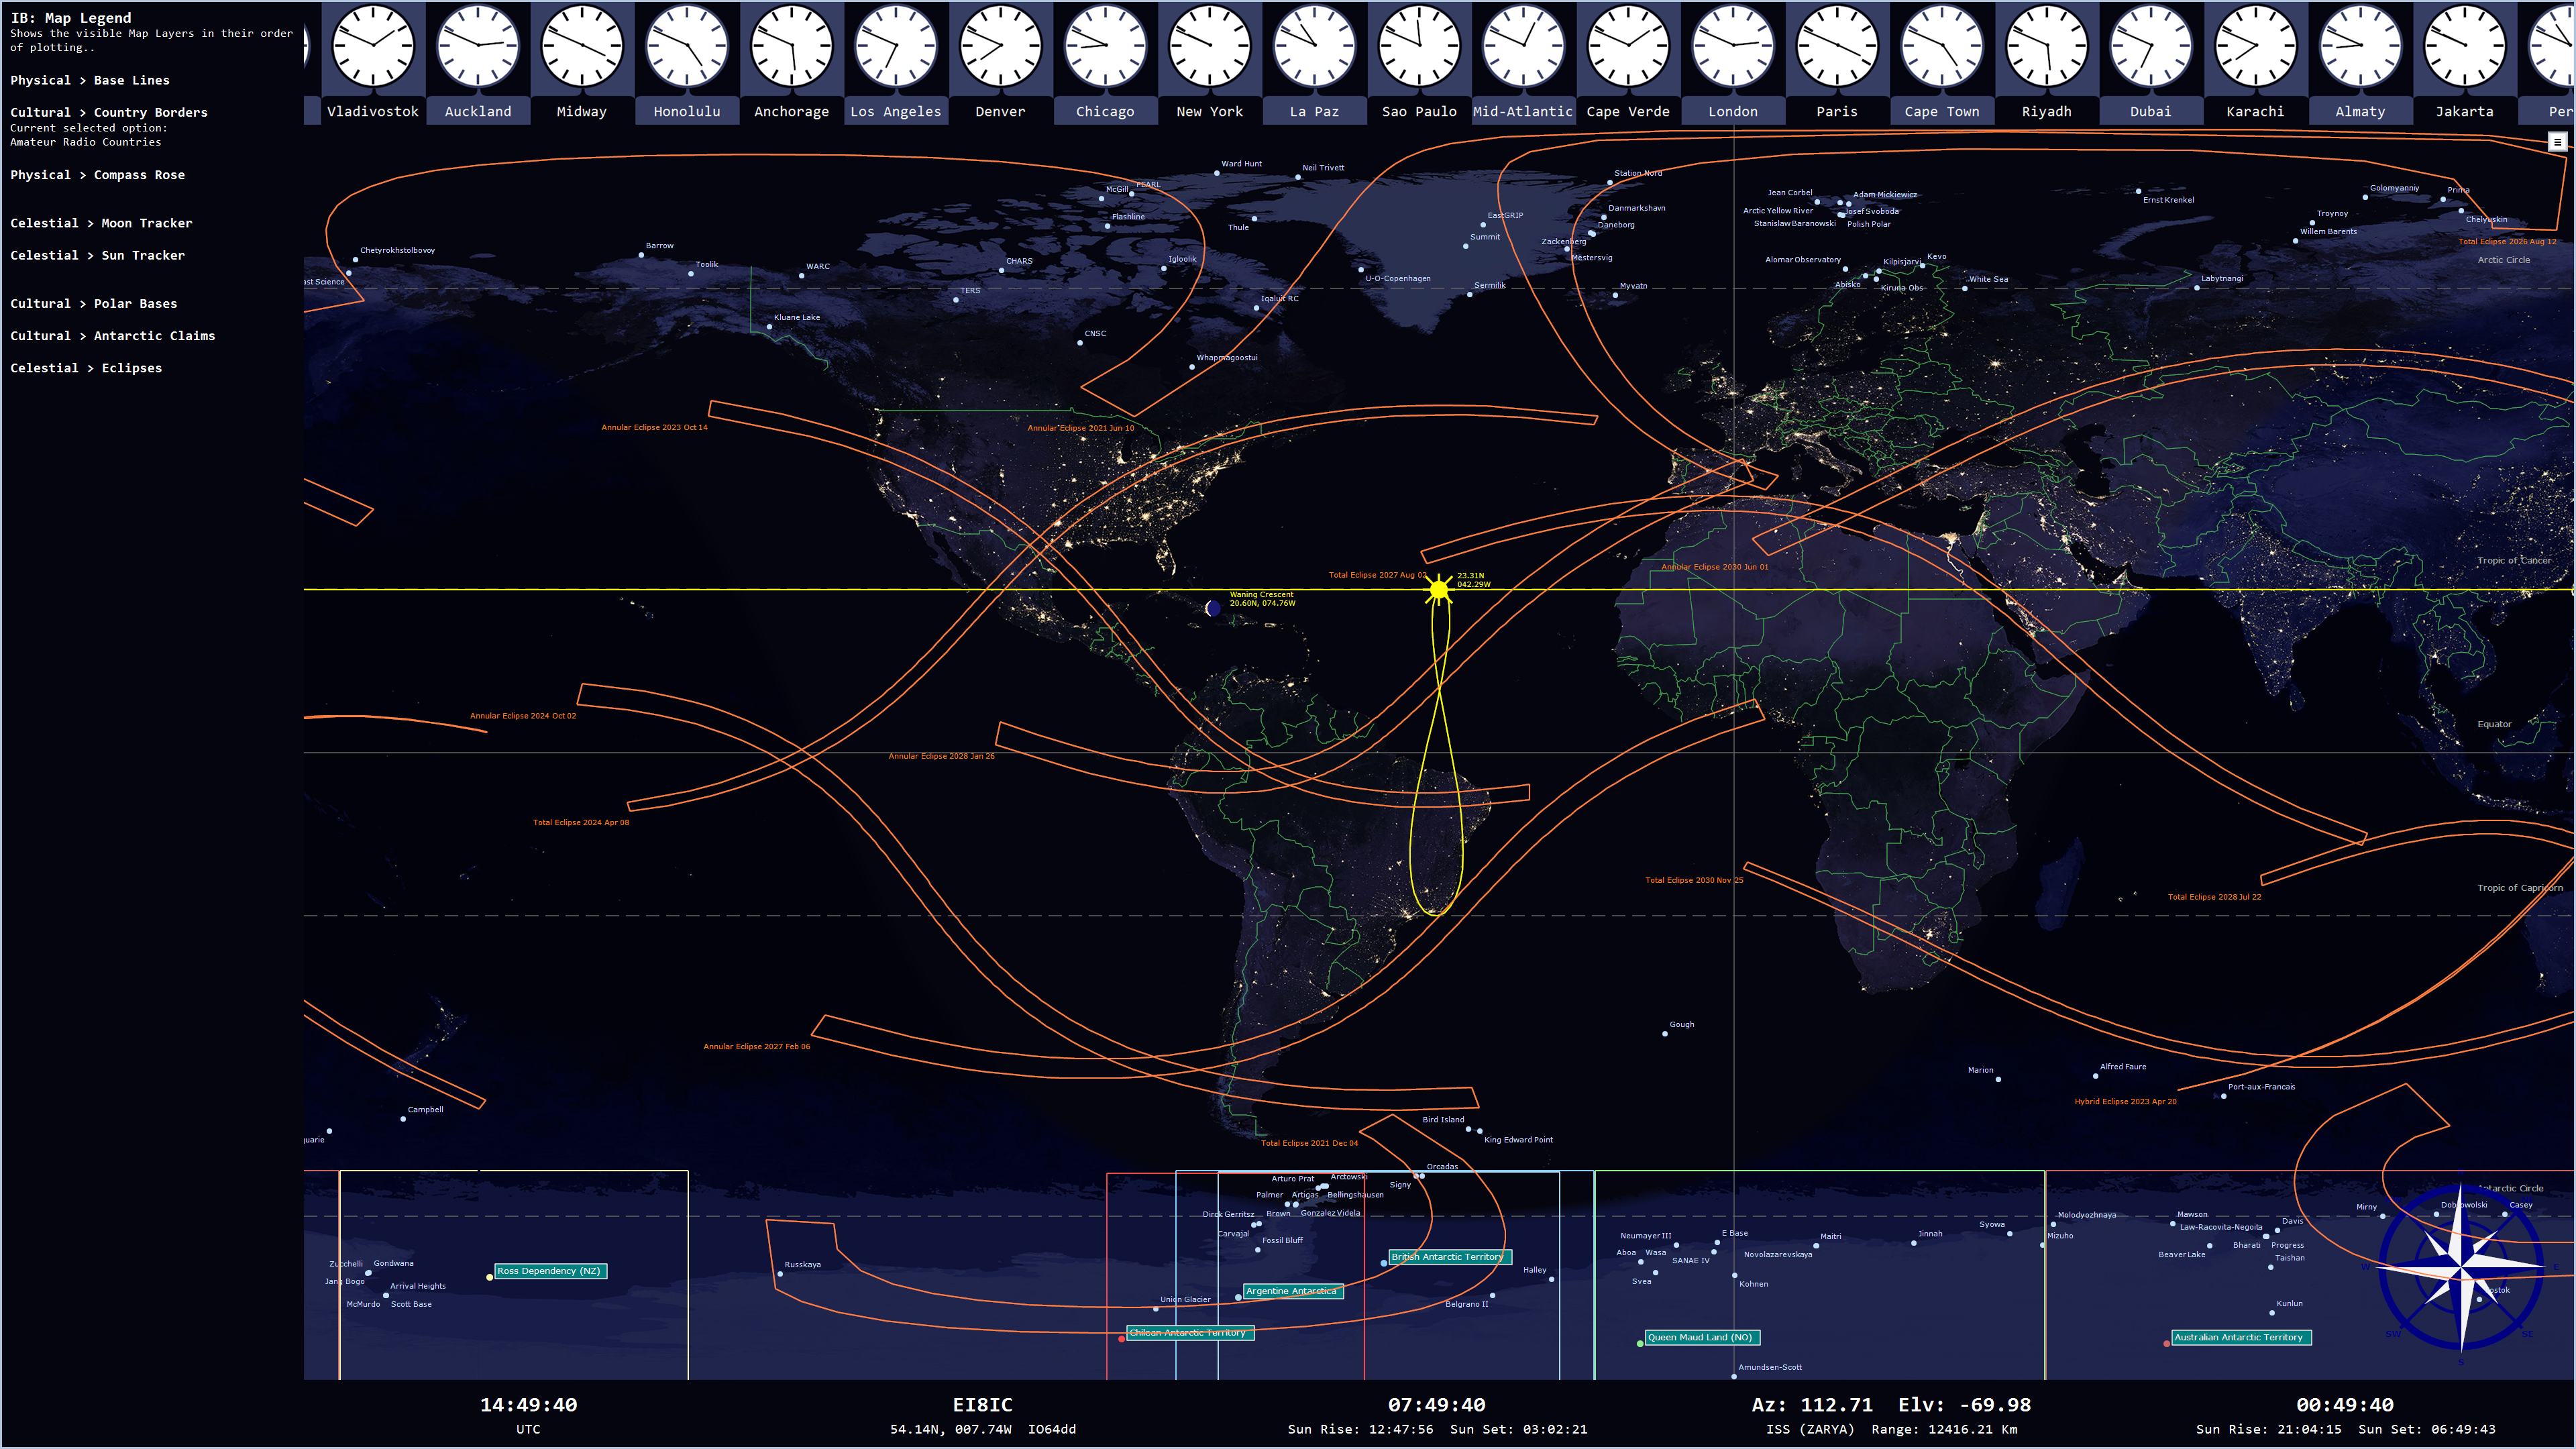
Which Antarctic Claims did the Total Eclipse of December 2021 cover? Where should you go in 2030 to see a Total Eclipse in Namibia? Where are the Arctic Research stations located? This map might help. Showing the Eclipses for the Decade 2021-2030 over the Night Base Map gives you a good idea which major cities will be covered. Eclipses are generated for all decades until 2100. |
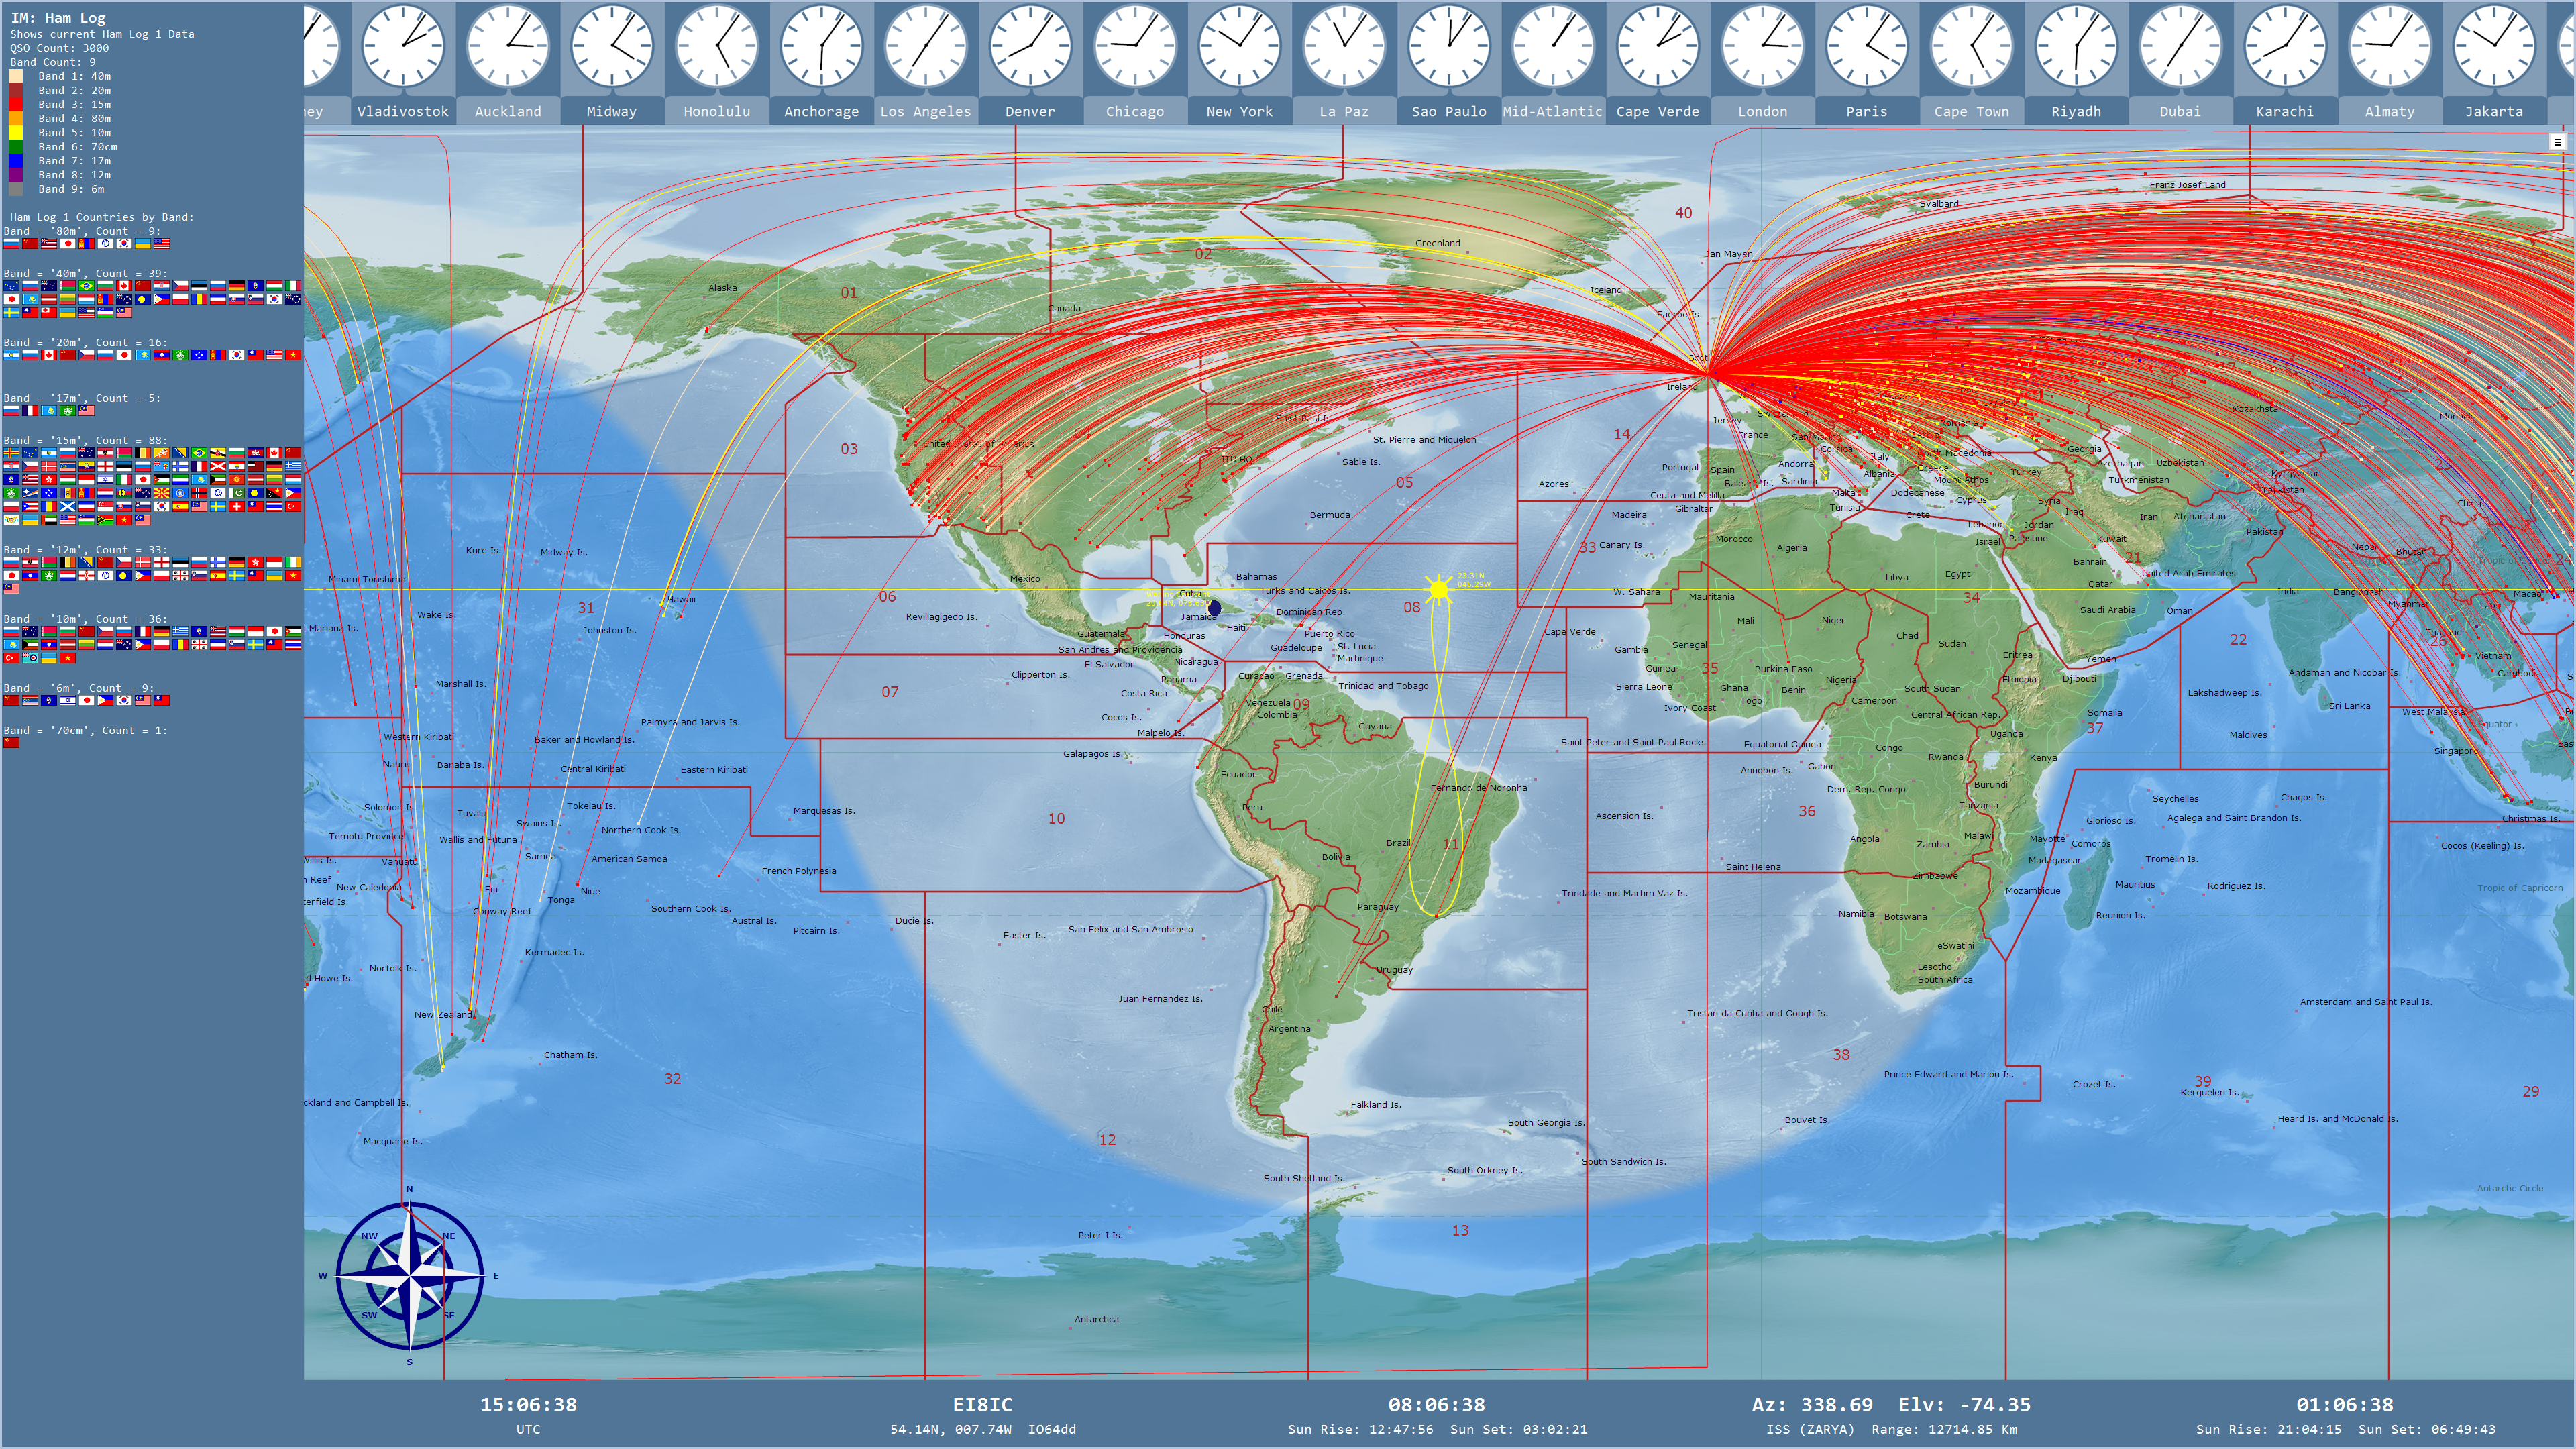
Of course, if you do like busy maps, you can plot a log with points and lines for every QSO, and use different colors for each band. The Info Bar is showing countries per band. It will cycle through a number of different log statistic pages. I've chosen a single color for the Gray Line terminator, with low transparency. Country names don't overlap, and you can choose which ranking to display them in. |
|