|
Here are some screenshots of the North-American Overlay Mapper in action. Click any image to show that full sized image in a new browser-tab.
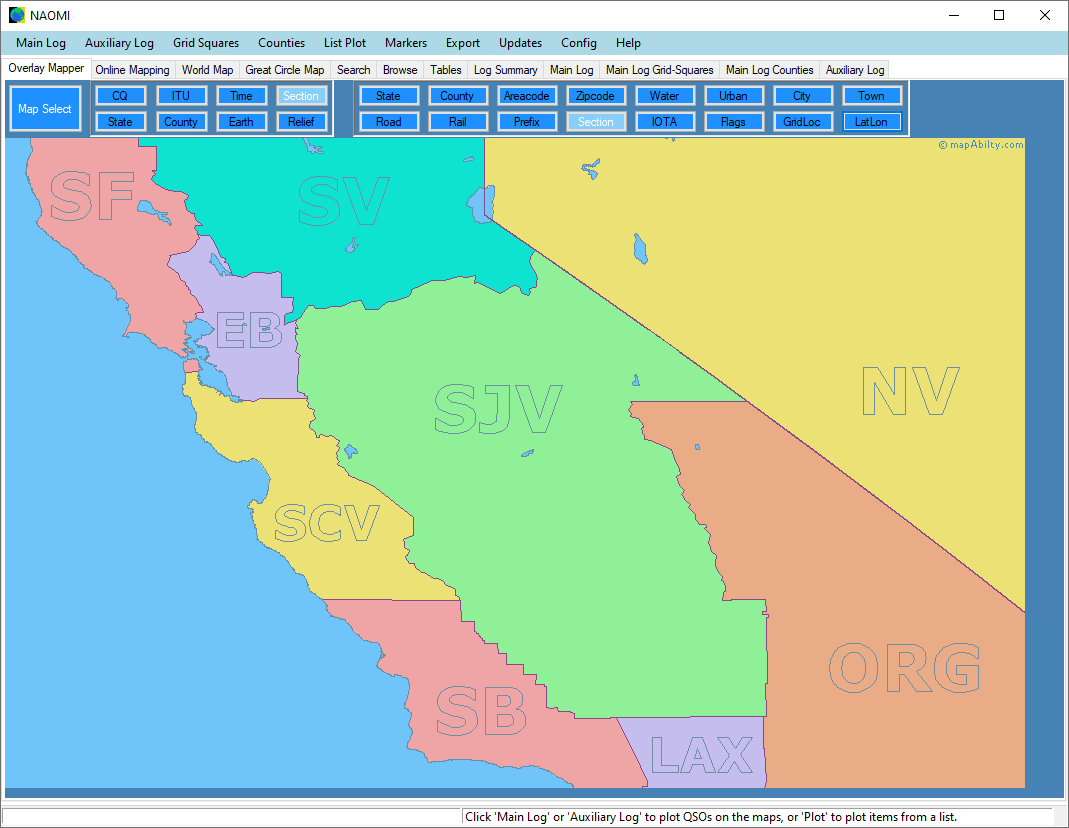
Let's start with a basic view of one of the 47 1:2,000,000 scale maps. Overhead, the 8 buttons on left select the 8 different backgrounds to the map. Only one background is shown at a time. The 16 buttons on the right select the map foregrounds. You can show as many of these as you like, stacked in any order. At the moment, only one foreground has been turned on. |
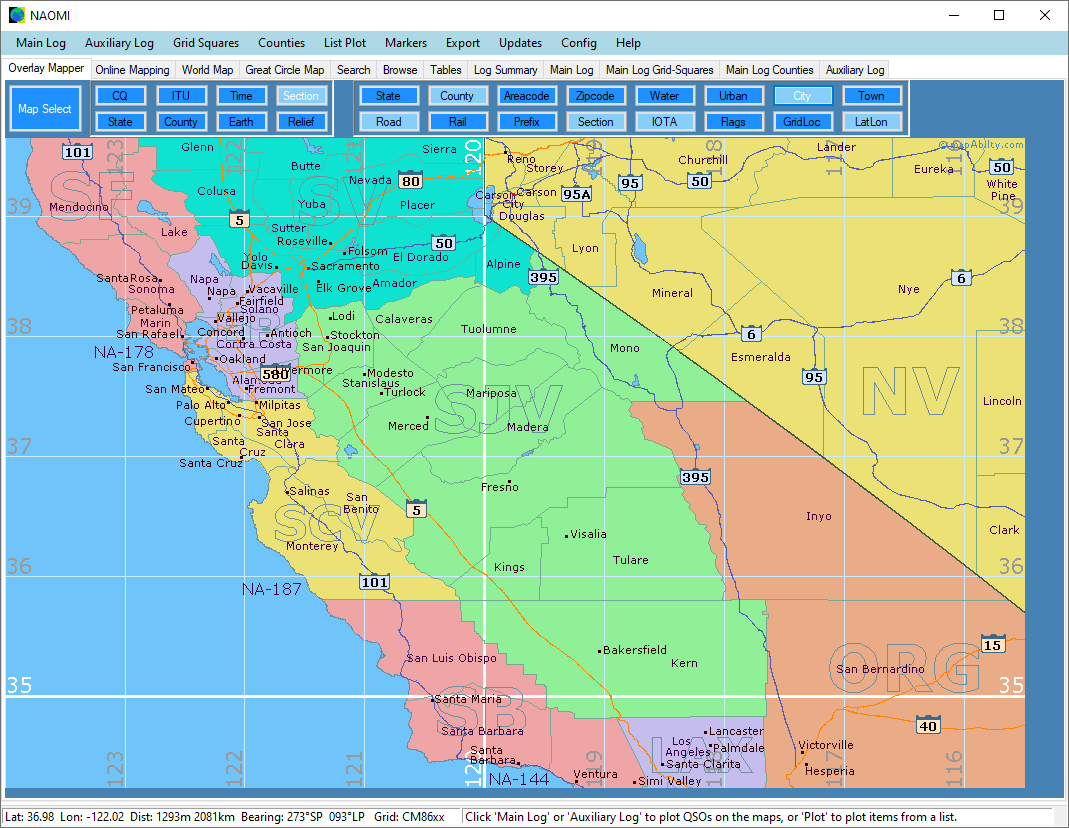
We are looking at the same 'Section' background as above, but now a number of different foregrounds are turned on. The Status Bar shows the position of the cursor, with distance and bearing to your Home Position. |
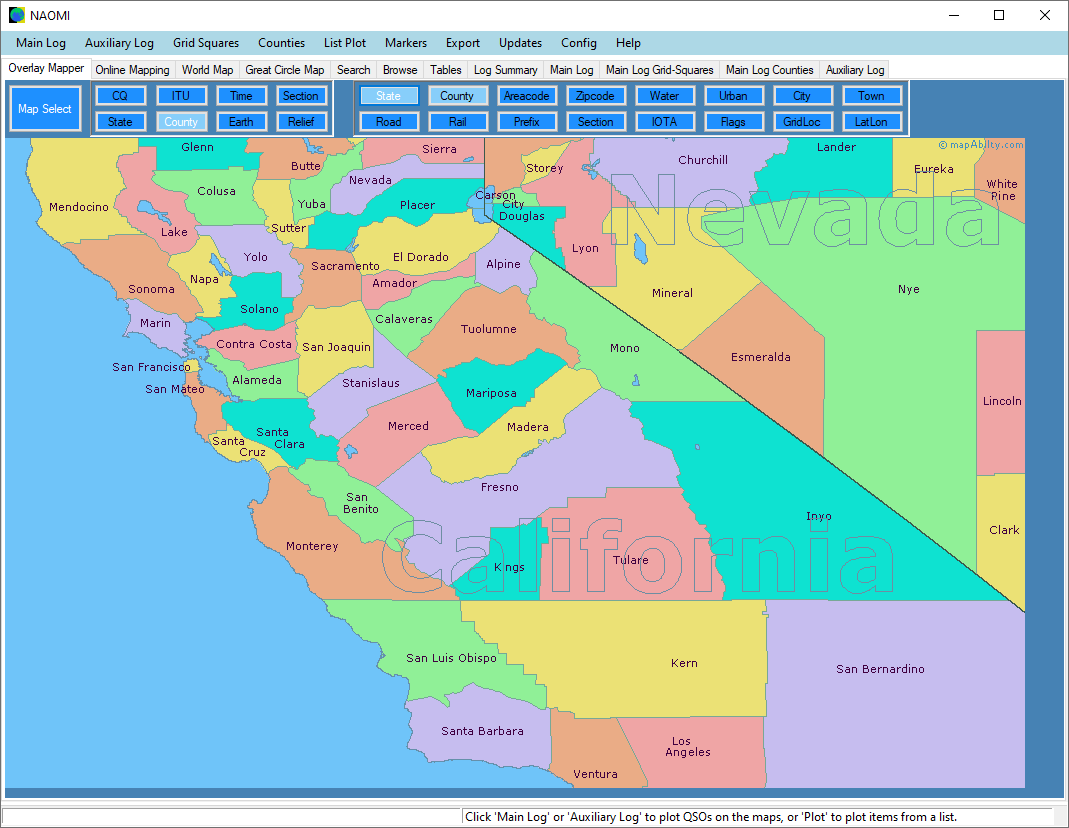
We have now swapped to a County background, with two foregrounds. You can plot Counties in your log as county-outlines on the maps. |
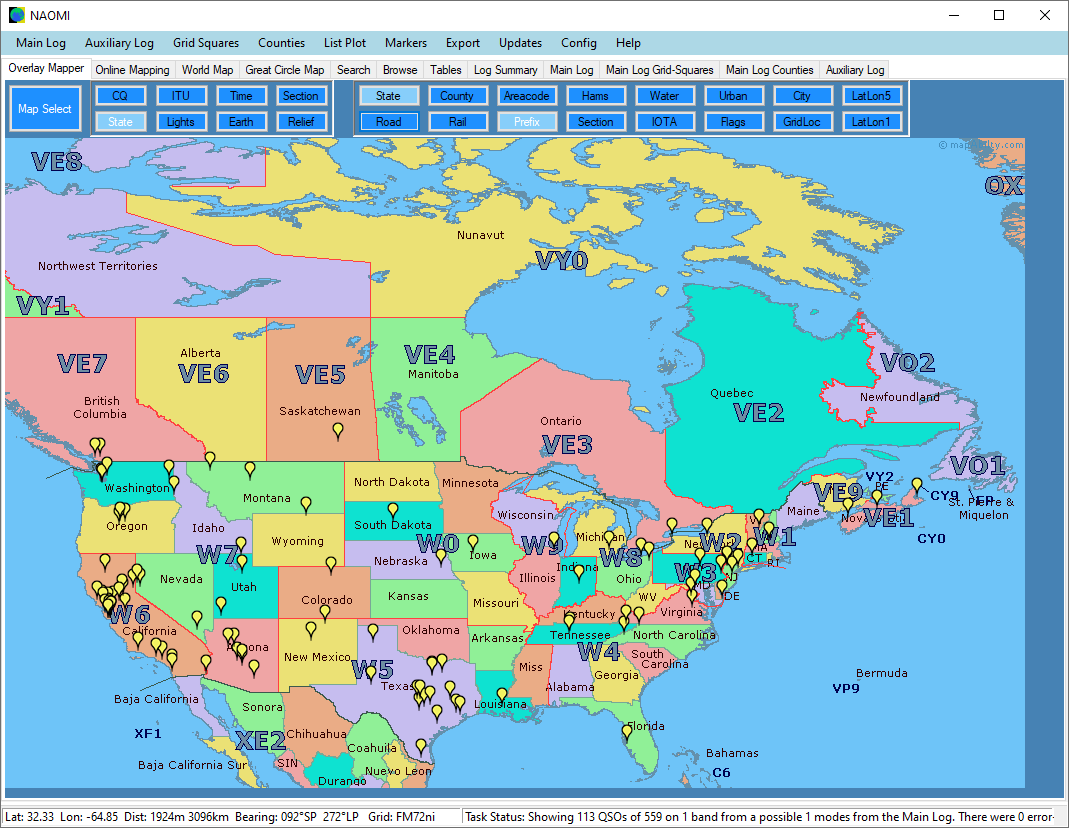
Here is one of the North American overview maps at 1:20,000,000 scale. We have plotted the QSOs from 1 band in the Main Log, using yellow markers. There are 37 different marker-types available. Hover over any marker to get more information, or right-click to show that call in the logs, in the onboard Callbook, or use its position to perform a range of Position-Referenced browsing tasks. |
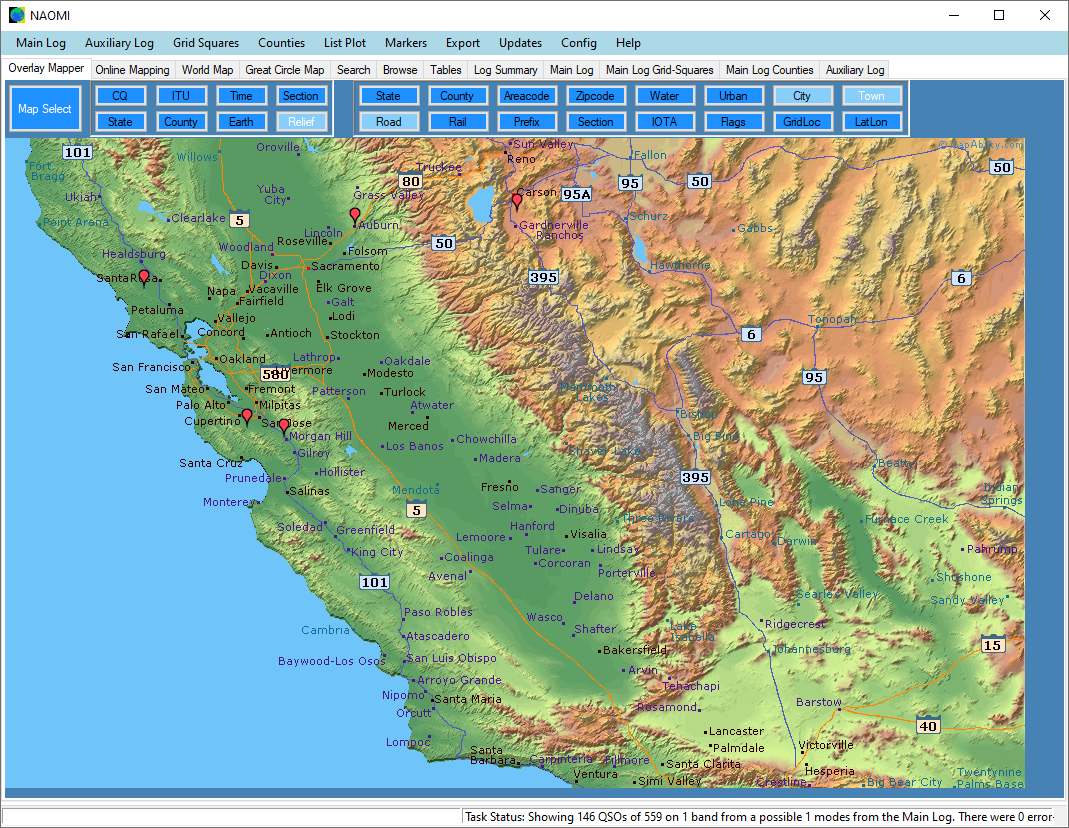
Here we are looking at one of the Relief background maps, with roads, towns and city foreground overlays turned on. The red markers show QSOs in the Main log on 1 band. Hover over any marker to get more information, or right-click to show that call in the logs, in the onboard Callbook, or use its position to perform a range of Position-Referenced browsing tasks. |
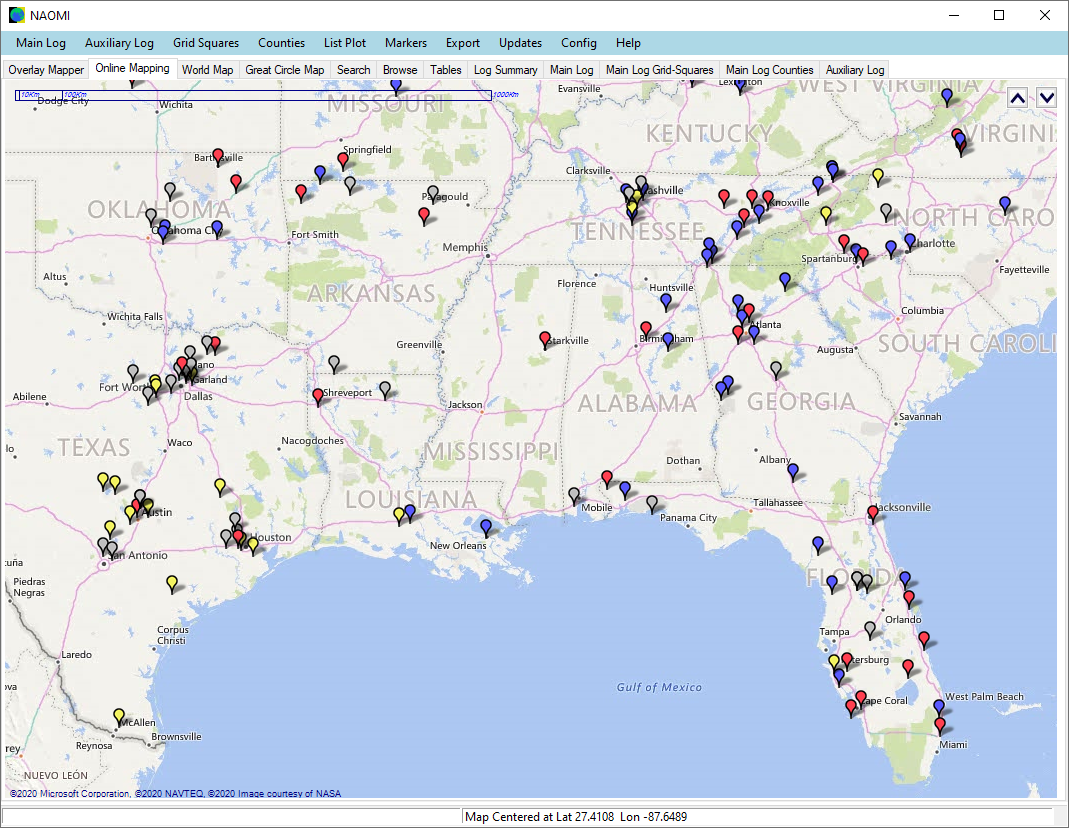
This is the Online Map, that requires an internet connection. You have a choice of different internet mapping providers. This one is from Bing Maps. It shows log QSOs plotted on the map as markers. The different colors represent different bands or modes in the log. Each marker-type can be chosen from 37 different marker-types available. You can also create small 'Block Markers' in any color, that are ideal for showing large number of QSOs from a log, or an imported list of positions, or callsigns, which will be geo-referenced to entries in the onboard callbook. |
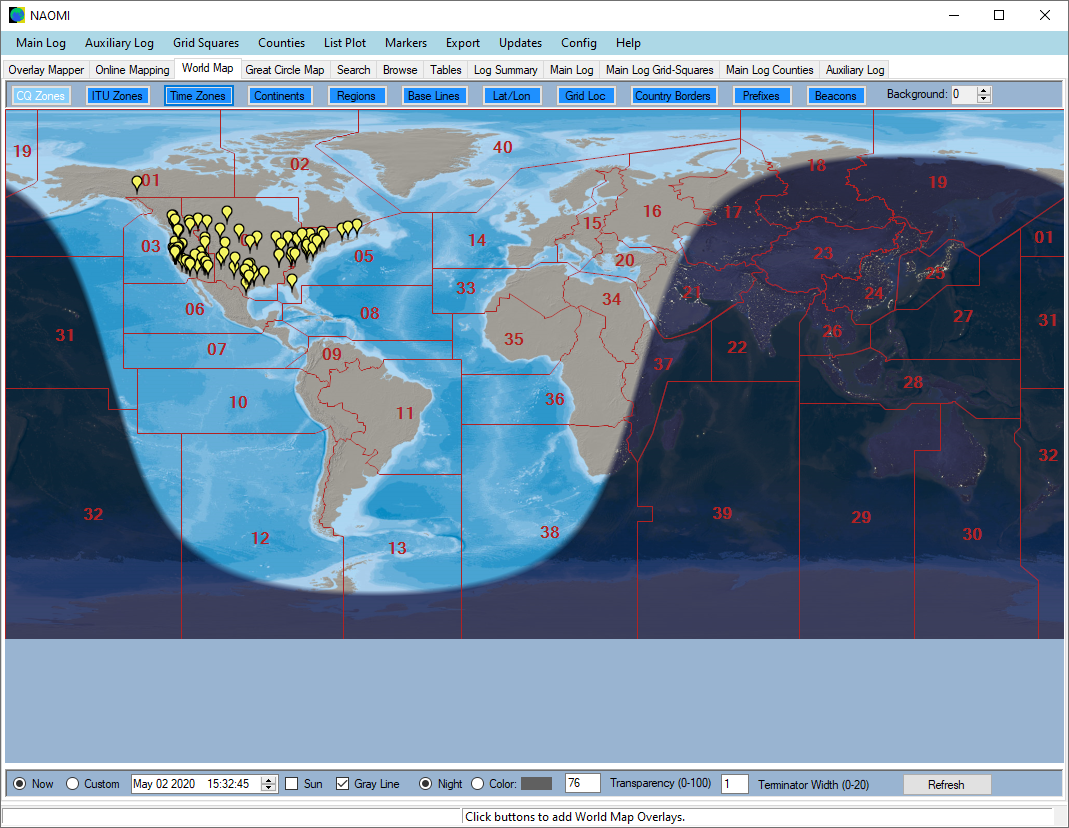
This is the World Map. It has 16 different background images, and 11 different foregrounds, each of which can be colored to suit the current background. At the moment, the 'CQ Zones' foreground is turned on. You can stack the foregrounds in any order, and add a GrayLine image using either a NightView satellite photograph, or a solid selectable color, with adjustable transparency. |
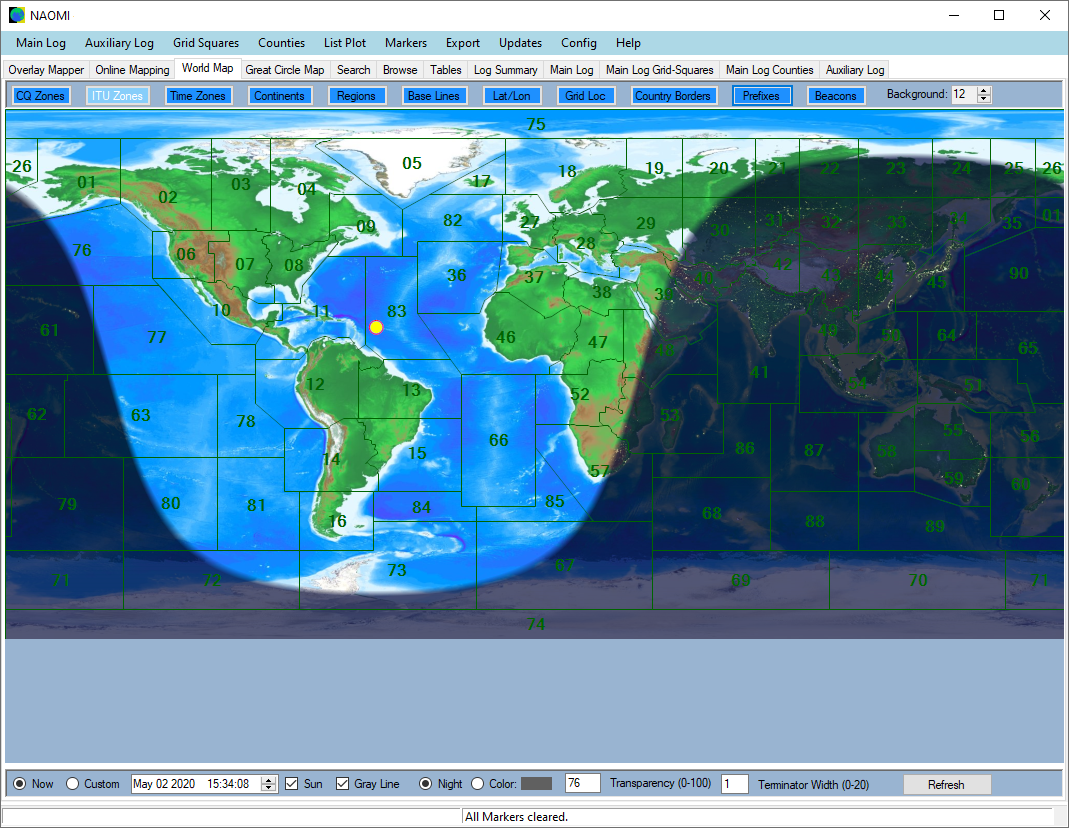
Here is another World Map background, created from actual World elevation data. The GrayLine image and the Sun position are showing, and the 'ITU Zones' foreground overlay has been turned on. You can change the colors, font, and font-sizes of the World Map foreground overlays at any time, with separate settings stored for each of the 16 different background images. |
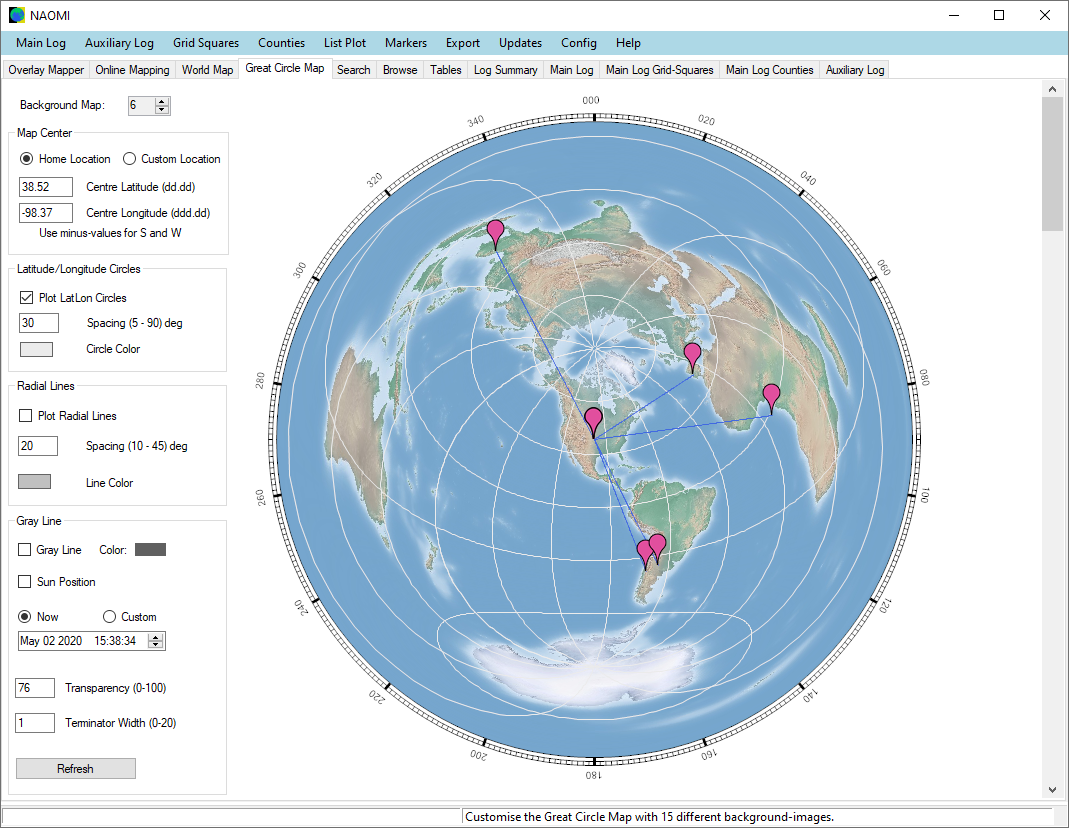
Included with 'NAOMI' is a Great Circle Map, that uses the same 16 different background images as the World Map. You can redraw the Great Circle Map for any center-position, and change the Latitude and Longitude circles and Radial Lines as required, with separate colors stored for each background image. This image shows some Ham Country Entities plotted on the map, with lines from the Home Position, which in this case is also the Map Center position. |
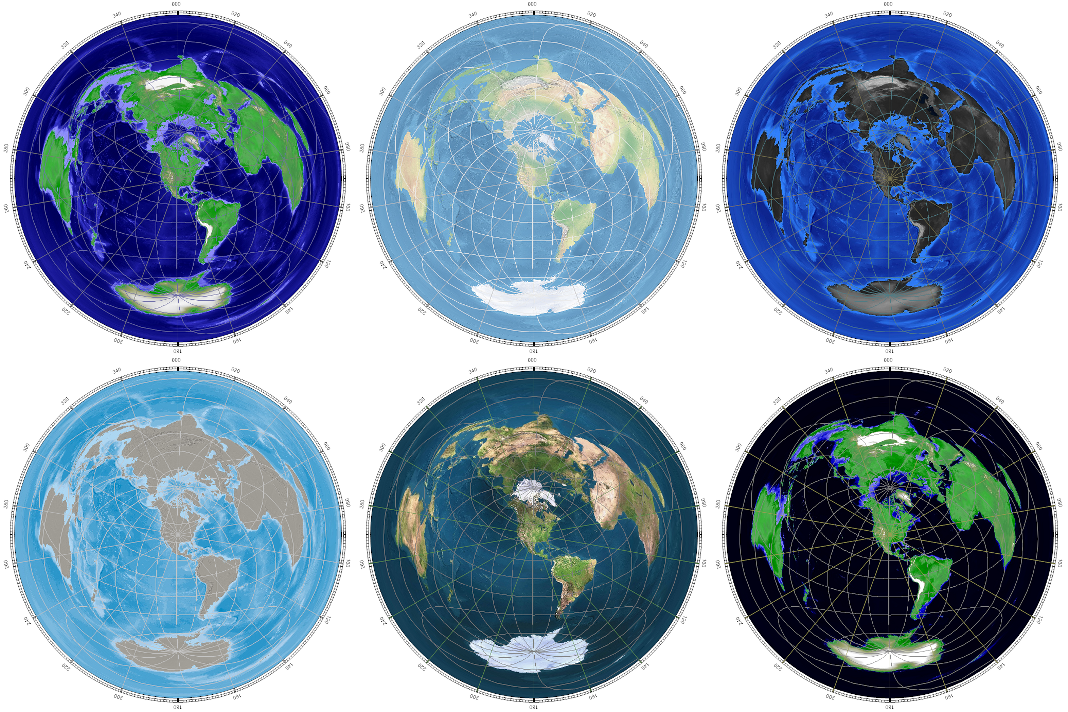
Here are some small images of just a few of the 16 different background images avavilable for the World Map and the Great Circle Map. I am sure that you will agree that there are not many Great Circle Maps as attractive as these ones are. |
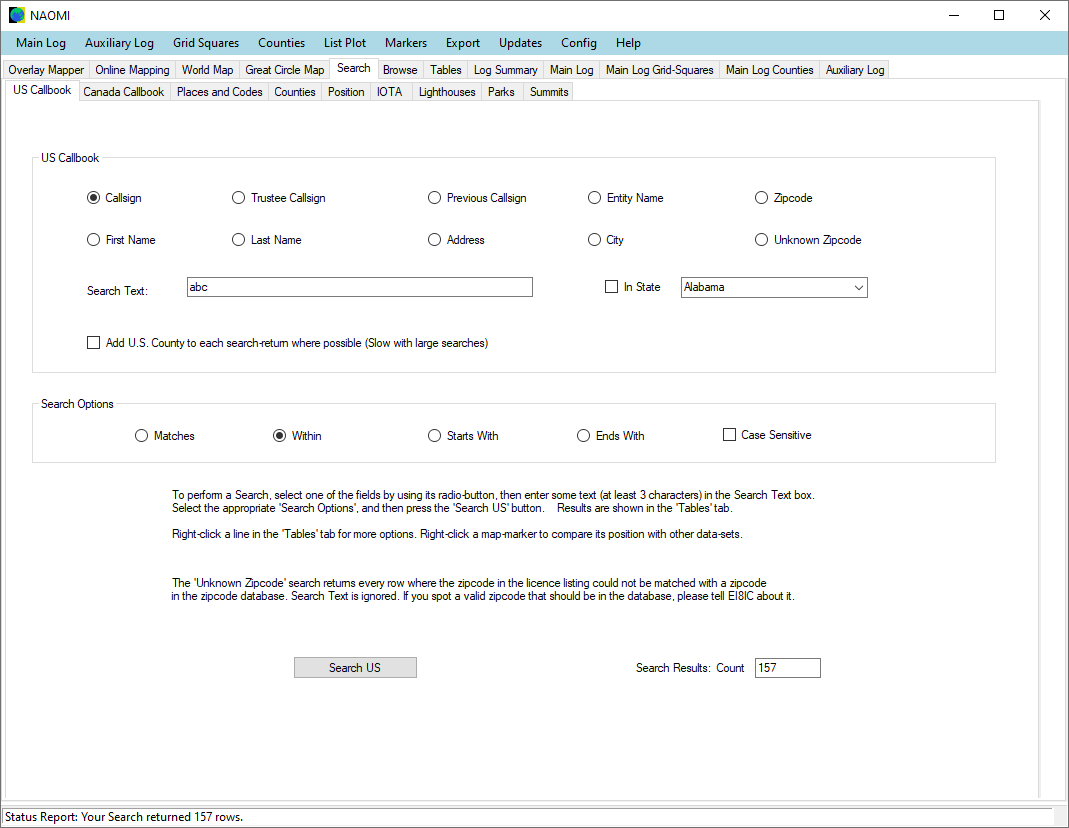
Away from the maps for a moment, lets look at the other things that the North American Overlay Mapper can do. Here we see the 'Search' tab-page, which opens out to another set of tab-pages covering all the different types of search that are available. NAOMI keeps the full FCC US Callbook on board, as well as the Canadian ISED one. You can download the latest issue as often as you like, then search in various ways. This image will give you a good idea of what is available. |
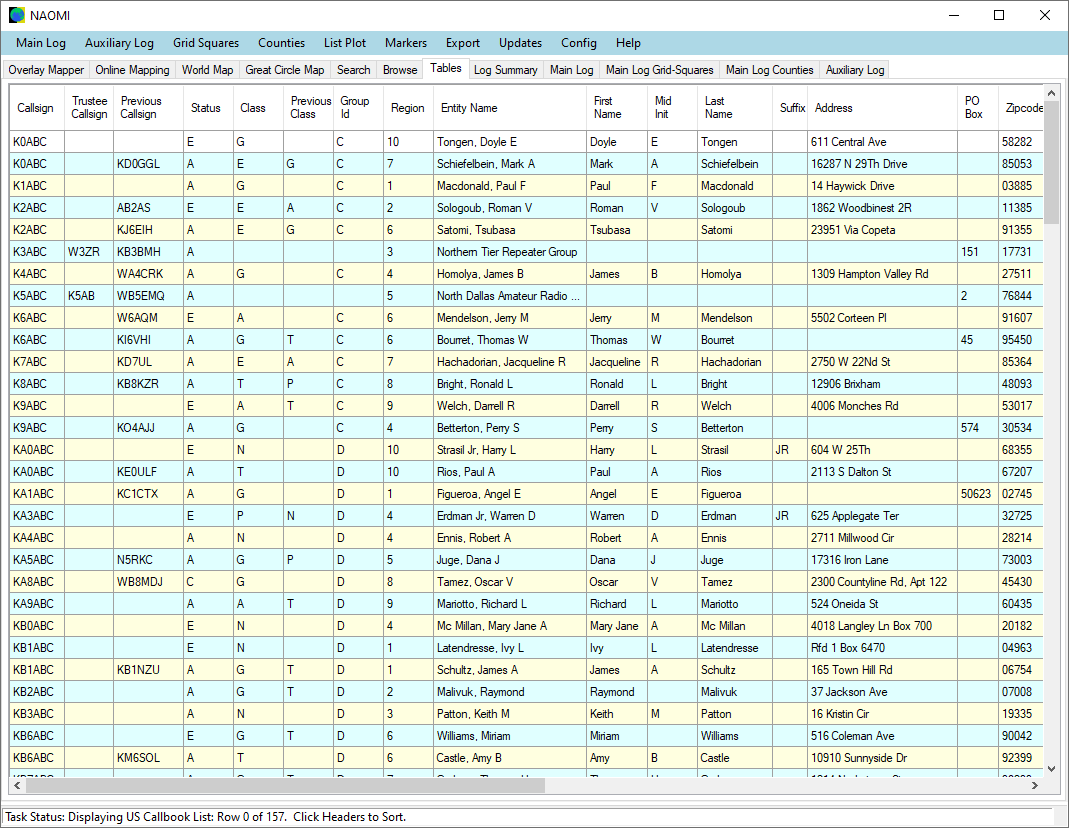
In the last image, we performed a simple search to look for Callsigns in the US Callbook that contained the letters 'abc' within the callsign. The search returned 157 results, and here we see them displayed on the 'Tables' tab-page. You can click any column-header to sort the results. Where possible, search returns are geo-referenced by US zipcode or Canadian postcode, so search returns can be plotted as markers on the 4 types of map. |
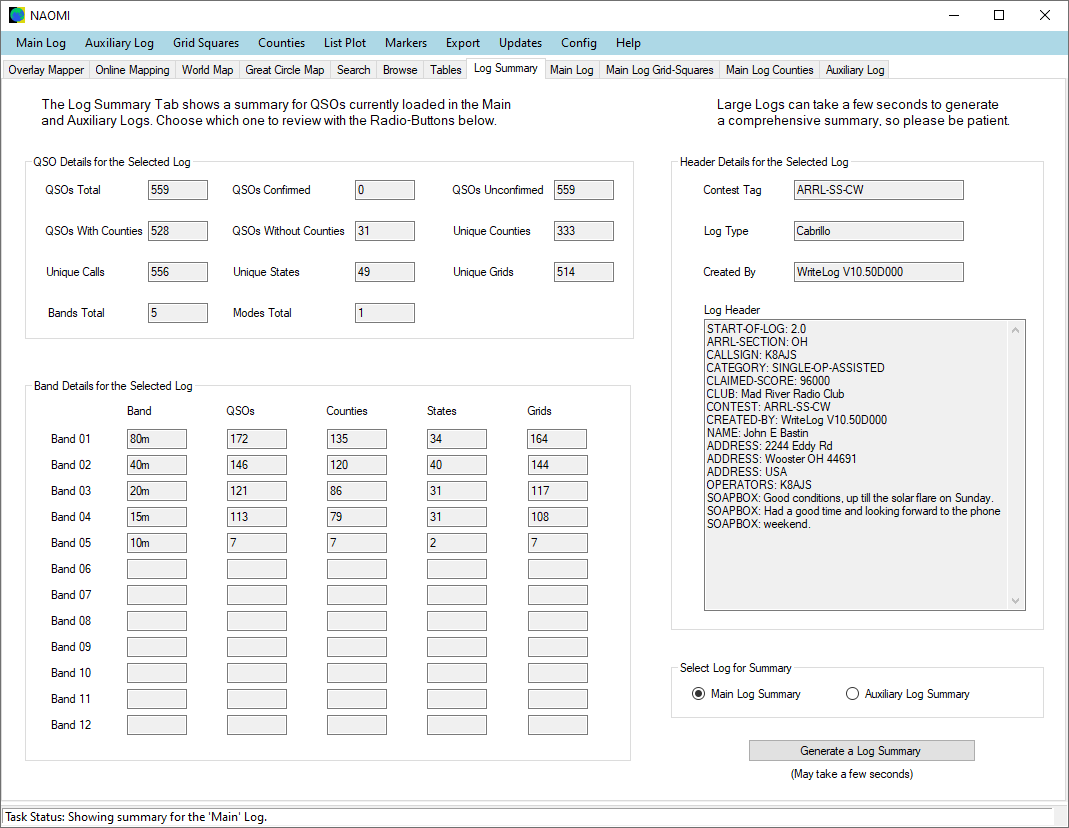
'NAOMI' has space for two separate logs: 'Main' and 'Auxiliary'. They can be loaded with ADIF or Cabrillo format logs, and the system has been tested with logs up to 85,000 QSOs. This image shows the 'Log Summary' tab-page, where you can generate a comprehensive summary of the current state of each log. It will identify and tally the unique Counties and Grid Locators for each band, which can then be plotted on to the 4 types of map. |
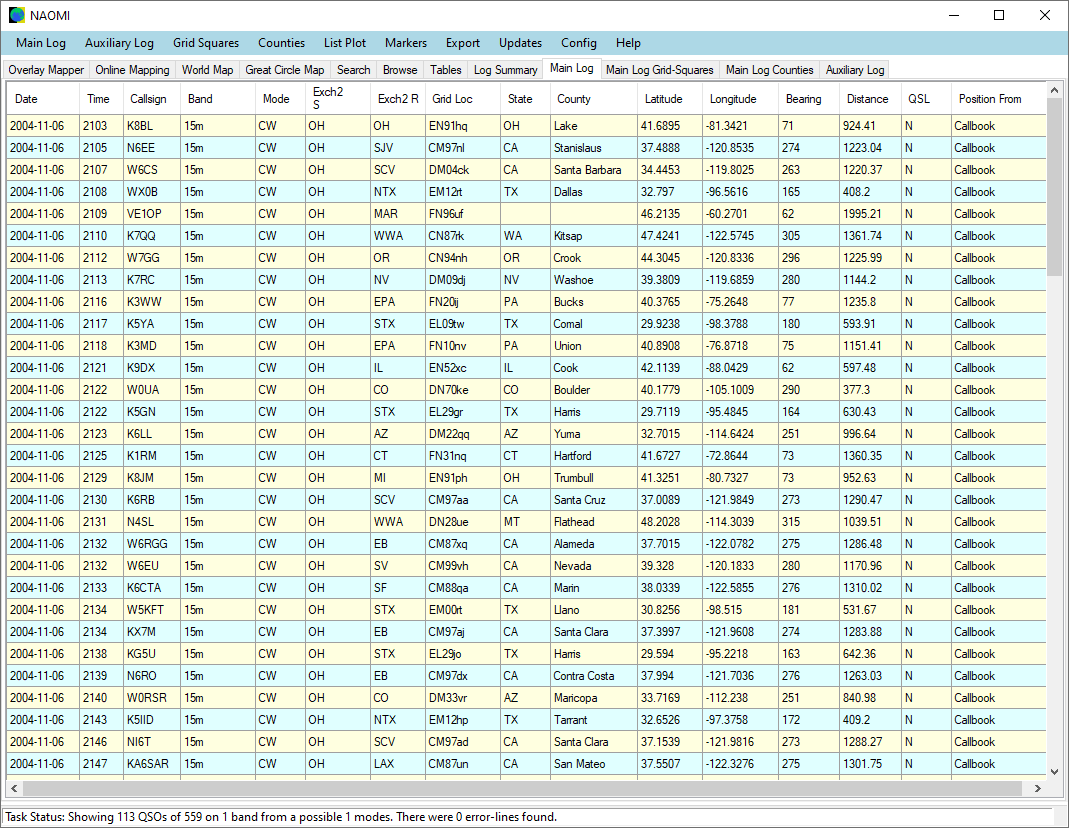
This image shows the 'Main' log, which has been filtered to only show the QSOs from the 15m band. Where possible, QSOs are geo-referenced from a variety of sources: Lat/Lon ADIF tags, Grid Locator ADIF tags, County centroids, or callsign-lookup in the onboard callbook. Note that, once loaded, the onboard callbook does not need an internet connection to access it, so NAOMI is ideal for a portable operation where internet is not available. When a QSO has been geo-referenced, you can plot it as a marker on one of the maps, or use its position for position-referenced database searching. |
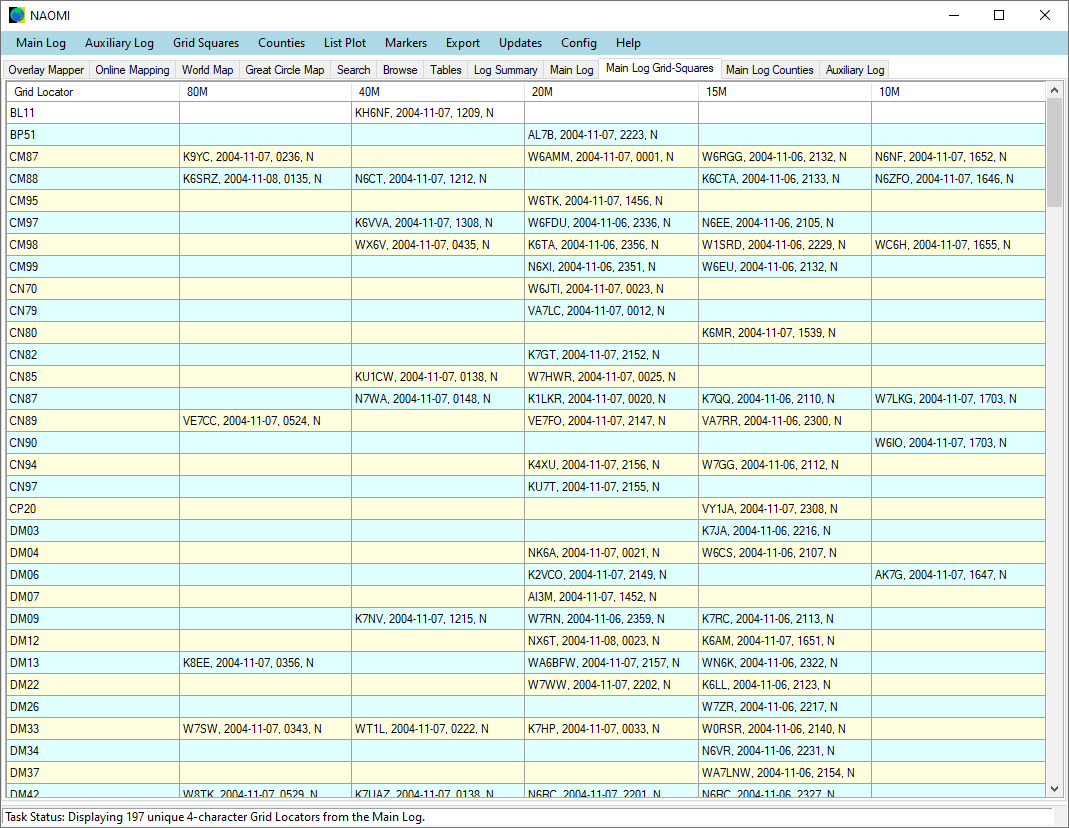
The big difference between Main and Auxiliary Logs is that the Main Log has its own tab-pages that lists all of the log's Grid Locators and Counties in tables that show the first QSO with each Grid Locator or County on each band. You can then plot the outline of the Grid Locator or County on the maps, or use its value to query the Log book to identify and plot QSOs corresponding to that value, for all bands, or just for one band. |
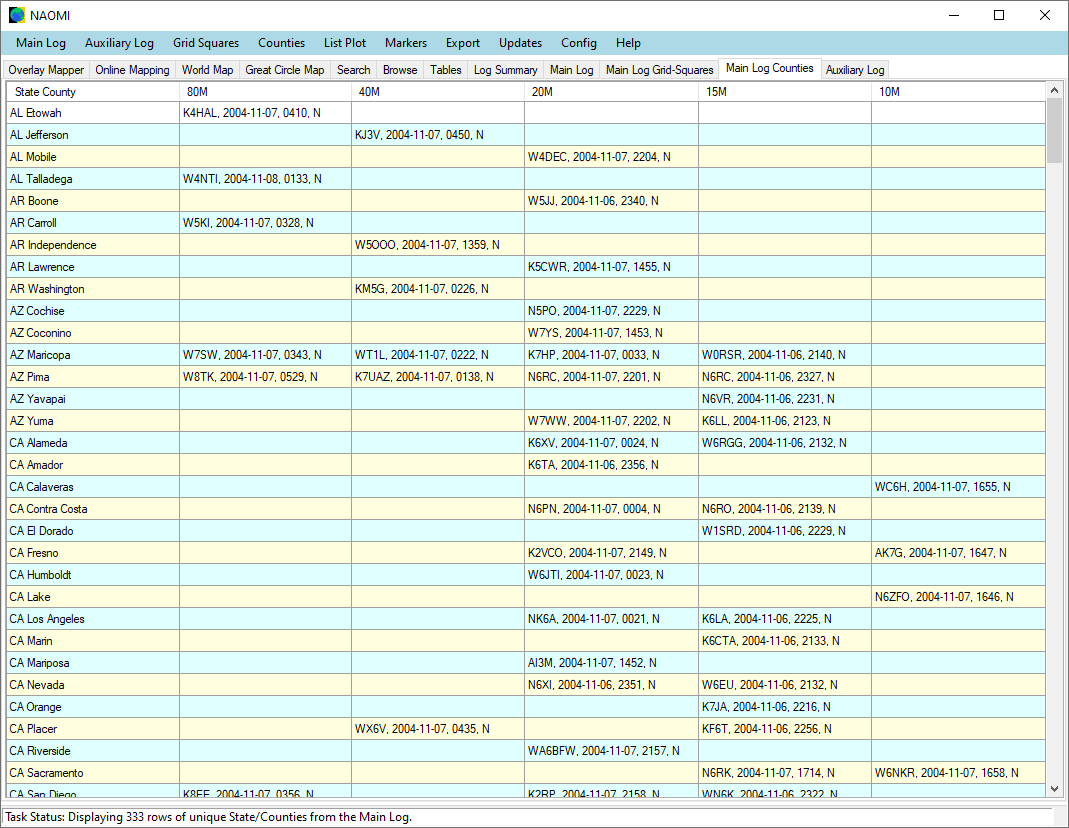
Here is an image of the table for the Main log's counties, showing how each has been cross-referenced to find the first QSO for each band. The cells show the callsign, date, time, and QSL status. A right-click menu provides a variety of data-plotting or searching facilities. |
|